Data-Driven Content Planning for B2B Lead Generation
Most B2B teams rely on intuition to decide what content to create. They publish blog posts about trending topics, webinars nobody attends, and case studies that sit unread. The result? 74% of B2B marketers report content marketing is effective for generating leads, but the median MQL-to-SQL conversion rate sits at just 13%, while top-quartile teams reach 28% or higher. That gap isn't talent—it's data. Data-driven content planning closes the gap by aligning every piece of content to your buyer's journey, measuring performance by format and stage, and scaling what actually converts. Here's how to build a planning system that compounds your B2B lead generation.
Key Takeaways
- 13% median MQL-to-SQL conversion versus 28%+ for top performers indicates lead scoring and nurture automation are major optimization levers (Martal Group, 2026).
- Interactive content drives 2× more conversions and 4–5× more page views than static assets, making format selection critical to planning (2026 benchmark).
- SEO generates leads at ~$31 per lead, 71% cheaper than webinars at ~$72 CPL, but webinars outperform on conversion quality—mix both (2026 benchmark).
- Define Your Ideal Customer Profile and Intent Signals: Data-driven planning starts with mapping exact buyer personas, decision-maker titles, and intent signals your content must address.
- Align Content to the Buyer Journey: Awareness, consideration, and decision content require different formats—ebooks and webinars don't work equally well across all stages.
- Measure and Optimize by Format and Channel: Identify your highest-converting content type and channel combo, then scale aggressively into that mix.
- Implement Lead Scoring and Behavioral Automation: Top performers use behavioral data and AI-powered scoring to qualify leads faster, reducing MQL-to-SQL time and improving conversion rates.
- Automate Content Research, Writing, and Distribution: Teams publishing 3+ articles weekly reach more buyer intent signals, compound domain authority faster, and capture organic traffic that traditional strategies miss.
How Does Data-Driven Content Planning Differ From Traditional Planning?
Traditional B2B content planning starts with a topic brainstorm: "What should we write about?" Then teams create content based on what sounds interesting or what competitors are covering. Data-driven planning inverts this. It begins with buyer data, search demand, and historical performance, then works backward to decide what content to produce. 91% of B2B marketers use content marketing, but only those measuring performance by funnel stage see compounding returns.
The Planning Difference: Intuition vs. Intent Data
Traditional planning is topic-first and audience-second. You pick a topic, write the content, then hope it reaches the right person. Data-driven planning is buyer-first. You identify who's searching, what problems they're trying to solve, and at which stage of their journey they need help. Then you build content to answer those specific queries.
The difference shows in conversion. When you target audience intent with high precision—knowing a searcher is in the consideration phase and looking for comparisons—you're more likely to capture a qualified lead. Generic thought leadership articles don't have that targeting. They rank broadly but convert weakly. Targeted comparison pages, persona-specific guides, and decision-stage case studies rank narrower but convert 2–3× higher because they answer the exact question the prospect is asking at the exact moment they're asking it.
"Data-driven planning doesn't guess about what content matters. It measures which pieces drive qualified leads at each stage, then scales relentlessly into those winners while eliminating the losers."
This is why top-quartile B2B teams document each content piece's performance: which funnel stage it captures, what channels it drives, and what MQL-to-SQL conversion rate it generates. They then double down on the winners and kill the losers. Traditional planning doesn't track this. Data-driven planning is ruthless about it.
Why Historical Performance Data Matters Most
Your own historical content performance is the richest data source you have. A blog post that generated 40 qualified leads in the past tells you far more than a competitor's top hit—because it's specific to your audience and sales process. Data-driven planning means auditing your existing content library, identifying which pieces drive the most qualified traffic, and building new content around similar topics, formats, and distribution channels.
For example, if your case studies consistently convert at 12% (visitors to lead), but your webinars convert at 2.3%, then webinars aren't your best ROI play. Your planning should reflect that. Allocate 60% of your content effort to the case study format, 25% to supporting formats that feed into case studies (like comparison pages), and 15% to experimental new formats. This allocation is grounded in data, not hope. According to Snov.io's 2026 lead generation research, teams that measure and optimize by format consistently outperform those relying on intuition.
How Do You Build an ICP-Driven Content Plan?
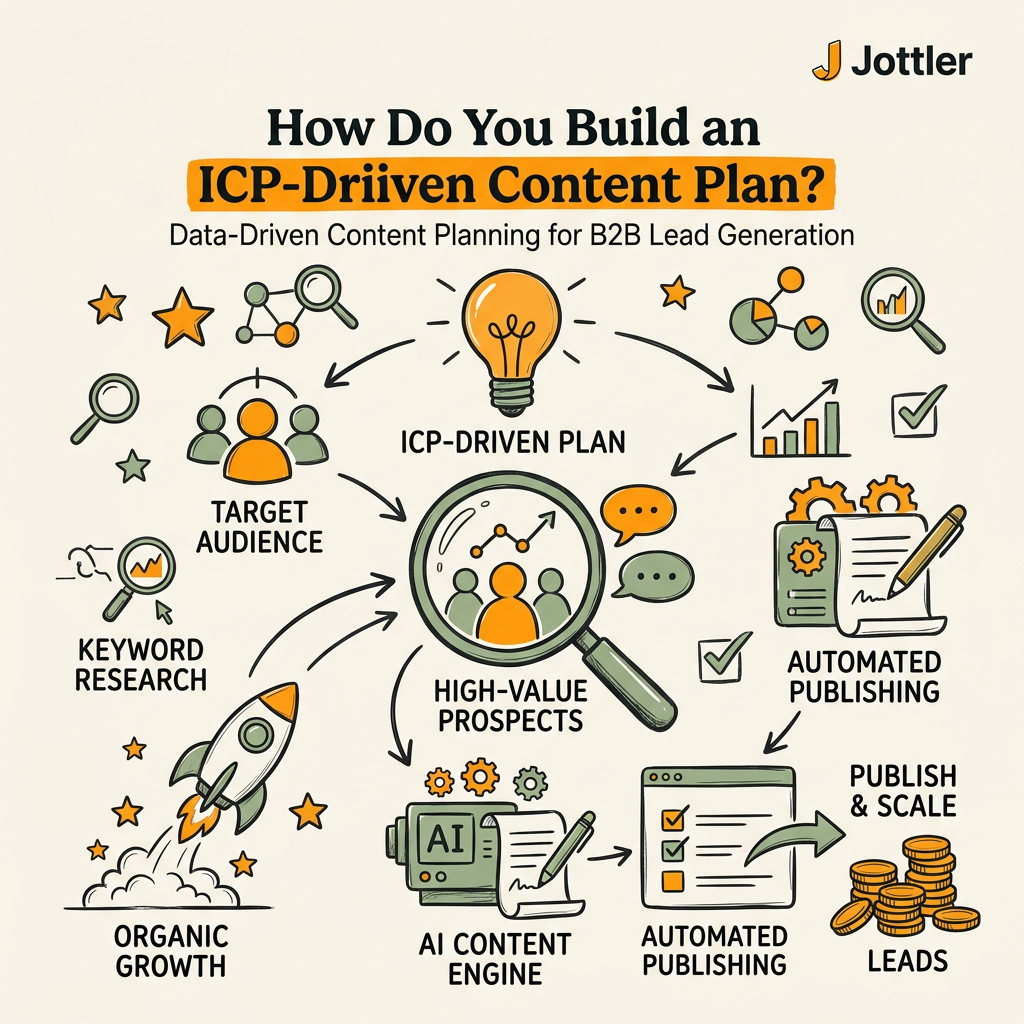
The foundation of data-driven content planning is an accurate Ideal Customer Profile. Without it, you're guessing at which buyer problems matter most, which titles need content, and which stages of the journey have the biggest leakage. A strong ICP-driven plan maps content to specific personas, buying committee members, and the questions they search for at each stage.
Define Buyer Personas With Intent Signals
A one-paragraph persona description—"Sarah is a VP of Marketing at a mid-market SaaS"—isn't enough. You need to map what questions Sarah is searching for, what language she uses when looking for solutions, and what objections your sales team hears most often from her peers. This is where search demand data and CRM notes become planning tools.
Start by documenting the top 5–8 buyer personas. For each persona, identify: their job title, company size, industry, typical pain point, and the search queries they'd use to solve that pain point. If Sarah is evaluating marketing automation tools, she might search "marketing automation software comparison," "HubSpot vs Pardot," or "best marketing automation for demand generation." These specific queries should guide your content planning. If you're not addressing these queries, you're losing Sarah before the sales team ever talks to her.
Next, layer in behavioral intent signals from your CMS analytics, Salesforce data, and LinkedIn. Which blog posts convert most of Sarah's peers into leads? Which page types have the highest engagement time? Which traffic sources deliver the highest-quality MQLs? AI-powered SEO platforms that combine keyword research with behavioral automation can accelerate this discovery. But the core work is mapping personas to search intent and documented conversion behavior.
Map Content Clusters to Buying Committee Roles
Most organizations have multiple decision-makers. In a B2B SaaS purchase, you might have: the VP of Marketing (evaluating based on feature fit), the CFO (focused on cost and ROI), and the Director of Sales Operations (implementing day-to-day). Each persona has different content needs and searches.
Data-driven planning accounts for this. Your content cluster for "marketing automation selection" should include:
- For VP Marketing (Consideration/Decision): "Best marketing automation software for demand generation" (feature-focused, comparison table)
- For CFO (Justification/Economic Impact): "Marketing automation ROI calculator" and case studies showing cost-per-lead reduction
- For Sales Operations (Implementation): "How to implement marketing automation in 60 days" (tactical guide)
Each piece addresses a different buyer's journey stage and decision criterion. A VP Marketing doesn't need implementation guides—they need proof that the software scales. A CFO doesn't care about features—they care about payback period. Data-driven planning acknowledges these splits and builds content specifically for each.
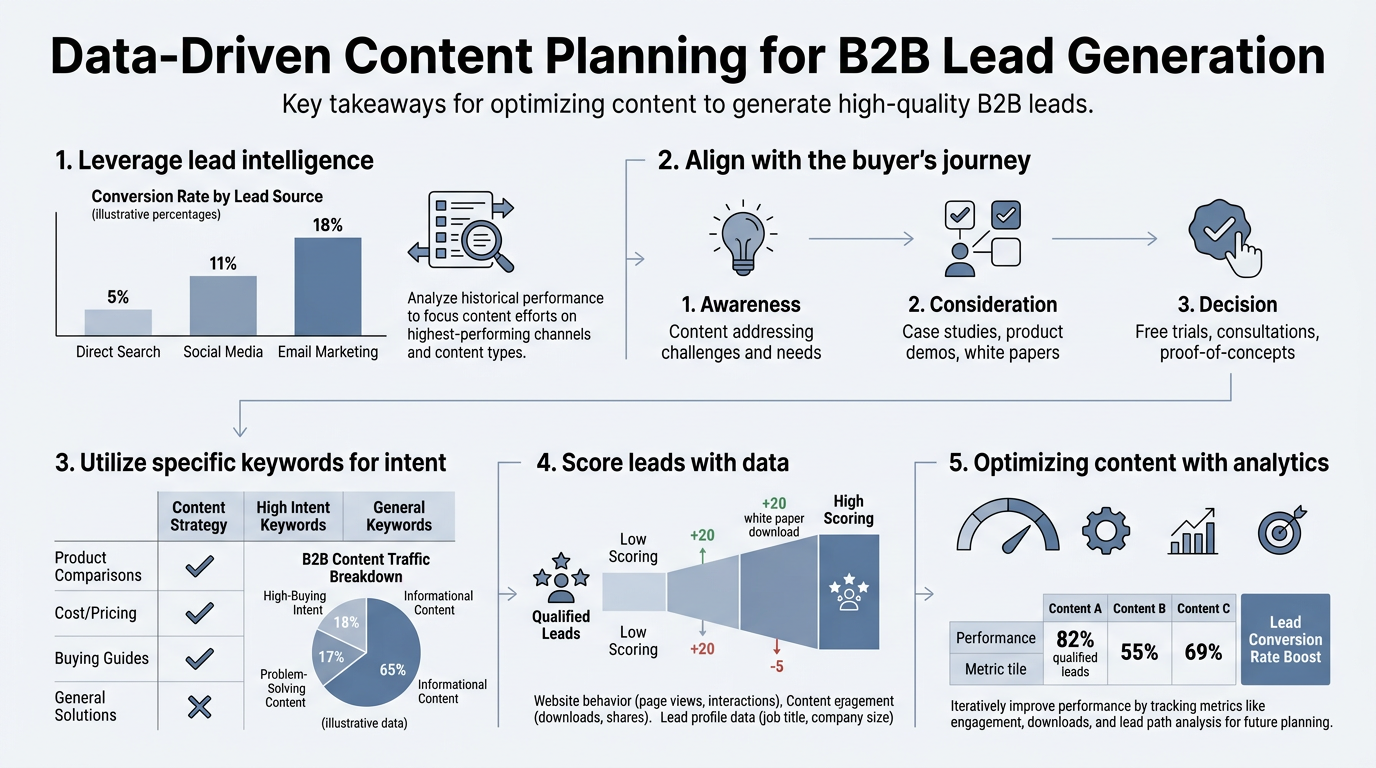
What's the Most Effective Way to Align Content to the Buyer Journey?
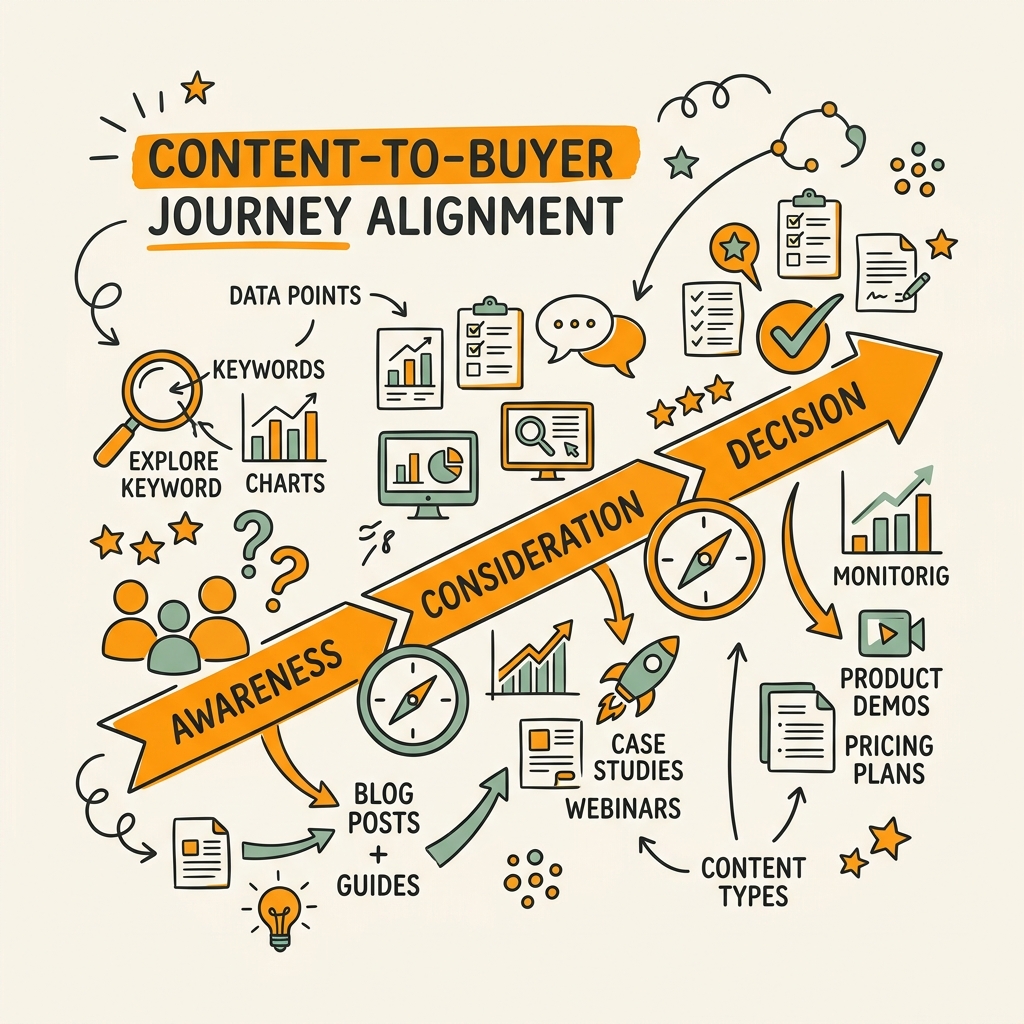
The buyer journey has three distinct stages: Awareness (the buyer recognizes they have a problem), Consideration (they're evaluating solutions), and Decision (they're choosing between vendors). Content needs are completely different at each stage. Awareness-stage buyers respond to broad, educational content. Decision-stage buyers want proof and comparison. Mixing these up wastes content spend and damages conversion rates.
Top-of-Funnel: Reach and Authority
Awareness-stage prospects are searching for problem definitions, not solutions. "Why is demand generation important?" "What's marketing automation?" "How to improve lead quality?" These queries have high volume but low immediate intent to buy. Content at this stage should be broad, educational, and SEO-friendly. Blog posts, guides, and educational videos work well here.
The goal of TOFU content is reach and authority-building, not immediate conversion. A prospect reading your guide on demand generation best practices doesn't need to fill out a form yet. They need to trust that you understand their problem. If you push a demo request on a TOFU piece, conversion rates crater. Data-driven teams keep TOFU content free and gated minimally, using it to build organic reach and feed bottom-funnel content to prospects who engage deeply.
Middle-of-Funnel: Nurture and Proof
Consideration-stage prospects are evaluating options. Webinars, case studies, and user reviews outperform other formats at this stage, with webinars averaging 2.3% conversion and case studies driving average-to-high engagement. These buyers are searching "marketing automation comparison," "Hubspot vs Pardot review," or "demand generation best practices for SaaS." They're beyond problem recognition—they're vetting vendors.
"The highest-converting content teams don't publish generically—they build persona-specific assets at each funnel stage. A comparison page targeting CFOs with pricing data converts fundamentally differently than one targeting technical buyers with feature breakdowns."
MOFU content should provide social proof and detailed comparisons without requiring a sales call yet. Case studies showing how peers in their industry solved the same problem are highly effective. Comparison tables, user reviews, and expert roundtables build confidence. Interactive content—product demos, assessment tools, ROI calculators—drives 2× conversions and 4–5× more page views than static content. A data-driven plan allocates significant resources here because MOFU content feeds the highest-quality leads to sales.
Bottom-of-Funnel: Decision and Urgency
Decision-stage prospects are ready to buy. They're searching for "request a demo," "[Your Company] pricing," or "how to implement [Solution] quickly." BOFU content should be vendor-specific, proof-heavy, and gated. Pricing pages, implementation guides, customer testimonials, and one-on-one case studies drive the highest conversion rates here because they're addressing the final objection: "Why should I choose you?"
BOFU content typically has lower search volume but higher intent and conversion. A blog post "Top 5 Marketing Automation Tools" might drive 500 visitors and convert 0.5% to MQLs (2–3 leads). A comparison page "Hubspot vs [Your Company]" might drive 50 visitors but convert 20% to SQLs (10 qualified deals). Data-driven planning recognizes this trade-off and allocates BOFU content strategically—every piece should be designed to close, not just engage.
How Do You Measure Content Performance to Scale Winners?
Data-driven content planning requires obsessive measurement. Most teams publish content and check traffic weeks later. Top-performing teams track three metrics from day one: organic traffic, lead conversion, and sales-qualified conversion. They use this data to identify which content types and channels compound fastest, then reallocate budget accordingly. Research from Martal Group's 2026 lead generation benchmarks shows that teams implementing systematic conversion tracking close the gap between median and top-quartile performance within 6 months.
Track Conversion by Format and Stage
Not all blog posts convert equally. A tactical guide like "How to Build a Demand Generation Strategy" might convert at 8% (visitor-to-lead). A trend piece like "5 Demand Generation Trends to Watch in 2026" might convert at 0.2%. Same channel, same audience, different format—completely different ROI. Data-driven planning tracks this granularly.
Create a simple spreadsheet tracking: Content Title, Topic, Format (blog, guide, webinar, case study, comparison), Funnel Stage (TOFU/MOFU/BOFU), Traffic, Leads, Lead Rate %, and Cost Per Lead. After 20–30 pieces of content, patterns emerge. You'll see that certain formats—say, case studies—consistently outconvert others. You'll see that MOFU content drives higher-quality leads than TOFU. Armed with this data, reallocate. If case studies convert 2–3× better than trend pieces, double your case study output and cut the trends.
This doesn't require expensive tools. A Google Sheet and CMS integration (pulling traffic and lead data) is sufficient. The rigor—actually measuring and acting on the data—is what separates data-driven teams from guessers.
Identify Your Best Conversion Channel Combo
Content reach comes from multiple channels: organic search, email, LinkedIn, paid ads, sales distribution. Each channel has different cost per lead and quality profile. SEO delivers leads at ~$31 CPL, email at ~$53 CPL, and webinars at ~$72 CPL. But CPL tells only half the story. A $31 lead from organic search might convert to SQL at 10%. A $72 lead from a webinar might convert to SQL at 40%. True cost-per-opportunity is CPL ÷ conversion rate.
Data-driven teams track not just traffic and leads, but downstream conversion. Which channel sends the highest-quality MQLs? Which has the fastest sales cycle? Which has the lowest CAC? Once you know this, you can feed more top-of-funnel traffic into your best-converting channels and shift budget away from inefficient ones.
For example, if you find that webinar attendees have 28% MQL-to-SQL conversion (vs. 13% median), then the economics of webinars change. You're willing to pay more per attendee because the quality is higher. Data-driven planning lets you make these decisions confidently instead of guessing.
Use AI-Powered Lead Scoring to Improve Downstream Conversion
61% of B2B teams now use AI for lead scoring, up from 23% in 2024. This shift matters because behavioral lead scoring—which identifies high-intent prospects earlier—dramatically improves MQL-to-SQL conversion. A prospect who visits three of your case studies, engages with your ROI calculator, and spends 5+ minutes on a comparison page is a higher-quality lead than a casual blog visitor. AI-powered scoring flags these high-intent prospects for sales faster, reducing time-to-contact and improving close rates.
This feeds back into content planning. If you know that interactive content (calculators, comparison tools, assessments) correlates with high lead scores, then interactive formats become a planning priority. You're not just building content for reach—you're building content for behavioral signals that predict sales-readiness. Platforms that combine content publishing with behavioral automation enable teams to track engagement, trigger workflows, and score leads automatically, accelerating this feedback loop significantly.
How Can You Scale Content Output Without Sacrificing Quality?
Most B2B teams publish 1–2 blog posts per month. At that pace, it takes years to build topical authority and compound organic traffic. Data-driven teams publishing 3–5+ articles weekly can tackle 15–20 times more buyer intent signals annually. The constraint isn't want—it's capacity. Hiring writers and editors is expensive. Manual content creation is slow. Data-driven teams solve this by automating research, writing, and publishing while maintaining quality standards.
Automate Content Research and Keyword Discovery
Content planning starts with knowing which keywords drive qualified traffic. Keyword research used to be manual: check search volume, assess difficulty, brainstorm topics. Top-performing teams now use AI-powered keyword research tools that automatically surface high-opportunity keywords—high volume, low difficulty, strong buyer intent—and group them into clusters for content planning.
This accelerates the planning process. Instead of manually researching 100 keywords monthly, an AI system can identify top opportunities in hours, surface related keywords for a content cluster, and even suggest complementary topics. Teams working with programmatic content systems can research 500+ keyword opportunities quarterly, enabling them to build dense, interconnected content clusters that rank across related queries.
Leverage AI Writing Systems With Human Fact-Checking
The concern with AI writing isn't quality—modern AI can produce publication-ready content. It's hallucinations and inaccuracy. AI systems sometimes cite statistics incorrectly, make up sources, or state unverified claims as fact. Data-driven teams don't avoid AI; they add human fact-checking layers to catch errors before publishing.
A high-velocity content system works like this: AI writes a draft based on brief, keyword-focused outlines (15 minutes). An editor fact-checks every statistic, source, and claim against authoritative sources (30 minutes). A subject-matter expert reviews for accuracy and depth (15 minutes). The piece publishes. Total time: 1 hour per article. Publishing 5 articles weekly at this pace is sustainable for a small team.
The economics are compelling. Manual writing at high quality might take 4–6 hours per article. AI-assisted writing with fact-checking takes 1 hour. That's a 4–6x productivity gain. For founders and small teams, this is the difference between publishing 0.5 articles weekly (manual) and 5 articles weekly (AI-assisted), compounding organic traffic 10x faster. Systems that combine AI writing, automatic fact-checking, and CMS integration enable solo founders to outpublish entire content teams.
Implement Smart Internal Linking to Distribute Link Equity
Publishing more content without smart linking wastes SEO value. Every new article should link to 3–5 related existing pieces, creating clusters that search engines recognize as comprehensive coverage of a topic. Smart linking distributes link equity from high-authority pages to emerging ones, helping new content rank faster. It also improves user experience—readers can discover related content, increasing time-on-site and returning visitor rates.
Manual linking is tedious. Automated systems that suggest linking opportunities based on semantic relevance and search intent make this scalable. When you publish an article on "demand generation best practices," the system automatically suggests linking to related pieces: "Demand generation strategy," "Lead qualification frameworks," "MQL-to-SQL conversion metrics." One click and those links are in place, distributing link equity and creating an interconnected web of related content.
| Metric | Manual Publishing (1–2 articles/month) | AI-Assisted Publishing (5+ articles/week) | Impact |
|---|---|---|---|
| Articles Published Yearly | 12–24 | 260+ | 10–20x more topical coverage |
| Keyword Opportunities Addressed | 12–24 | 260+ | Captures 10x more buyer intent signals |
| Time Per Article | 4–6 hours | ~1 hour (AI write + fact-check) | 75% reduction in content creation time |
| Organic Traffic Growth (Year 1) | 20–50% | 150–300% | Compounding reach and domain authority |
| Cost Per Article | $500–1,500 (freelancer) | $30–50 (AI + tools) | 90% reduction in per-article cost |
Conclusion
Data-driven content planning transforms B2B lead generation from hope into system. By grounding every content decision in buyer data, measuring performance by format and stage, and scaling high-performing content types, teams close the gap between median (13% MQL-to-SQL conversion) and top-quartile (28%+) performance. The blueprint is straightforward: define your ICP and buyer intent signals, align content to the buyer journey, measure conversion ruthlessly, and automate what can be automated so you can scale volume without sacrificing quality.
The teams winning in 2026 aren't the ones publishing one thoughtful article monthly. They're the ones publishing 3–5+ pieces weekly, reaching more buyer intent signals, compounding organic authority faster, and capturing leads across the full buyer journey. The constraint isn't will—it's execution speed. By combining AI-assisted content creation with rigorous fact-checking and internal linking strategy, founders and small marketing teams can now publish at institutional scale without institutional overhead.
Start your SEO agent and begin publishing high-quality, data-driven content at scale. Let AI handle research, writing, and publishing while you focus on strategy and conversion optimization.
FAQs
What content format generates the most B2B leads?
Ebooks and webinars drive the highest registration rates in B2B, but conversion quality varies by buyer journey stage. Case studies and interactive content (calculators, assessments) generate the highest qualified leads because they attract buyers in consideration and decision stages. For sheer volume, blog content distributed via email and LinkedIn reaches the most prospects. For conversion quality, case studies and comparison pages win. The best approach combines both: build extensive blog content for reach and authority, then layer in case studies and interactive assets for conversion.
How long does it take to see results from data-driven content planning?
Organic traffic from new content typically takes 4–12 weeks to materialize meaningfully. However, lead generation begins earlier through social distribution and email—often within 1–2 weeks of publishing. The key is consistency. Publishing 1 article monthly shows minimal results; publishing 3–5 weekly shows compounding impact within 2–3 months as topical authority builds. Most teams see 50%+ organic traffic growth within 6 months of shifting to high-velocity, data-driven publishing. The compounds accelerate from there.
Do I need a large team to implement data-driven content planning?
No. Solo founders and small teams can execute data-driven content planning effectively using AI-assisted systems. The constraint isn't team size—it's infrastructure. Manual content creation is slow and expensive, making high-velocity publishing impossible for small teams. But AI-assisted writing, automated fact-checking, and smart CMS publishing reduce the time-per-article from 4–6 hours to ~1 hour. This enables founders to publish 5+ articles weekly alone, competing with larger content teams in reach and velocity. What once required a 3–5 person editorial team can now be executed by one founder leveraging automation tools.