Marketing Automation ROI: Measuring What Actually Matters
You've invested in marketing automation. The tool is live, your team is trained, and campaigns are running. But when your CFO asks, "What's the actual return?" the answer isn't obvious. That's because marketing automation ROI isn't a single metricit's a system of interconnected financial and operational outcomes. Companies see an average of $5.44 in return for every $1 spent on marketing automation, yet most teams fail to measure beyond vanity metrics like email opens or lead counts. The gap between potential ROI and measured ROI is where most automation investments leak value. Here's how to capture it.
Key Takeaways
- $5.44 ROI per $1 invested (544% three-year return) is the industry benchmark, with 76% of companies seeing positive results within 12 months (2026, Revenue Memo)
- Most teams measure email opens and lead volume instead of revenue impact, conversion velocity, and operational cost savingsthe metrics that actually matter for board reporting
- A proper ROI calculation requires a five-pillar framework: financial return, efficiency gains, capacity freed, customer retention value, and brand lift effects
- The ROI Measurement Gap: 77% of companies report higher conversion rates after automation, yet fail to attribute revenue correctly because they lack a measurement framework
- Five-Pillar ROI Framework: Financial return, efficiency gains, capacity freed, customer value, and brand liftmeasured separately to show the full value picture
- Cost Capture Is Critical: Hidden implementation, training, and integration costs are frequently underestimated, inflating perceived ROI by 40-60%
- Email Automation Leads Revenue: Automated emails generate $36 return per $1 spent and 320% more revenue than manual campaigns
- Payback Timeline: Most companies recoup their investment within 6 months; leadership expects proof by month 12
Why Most Marketing Automation ROI Calculations Miss the Mark
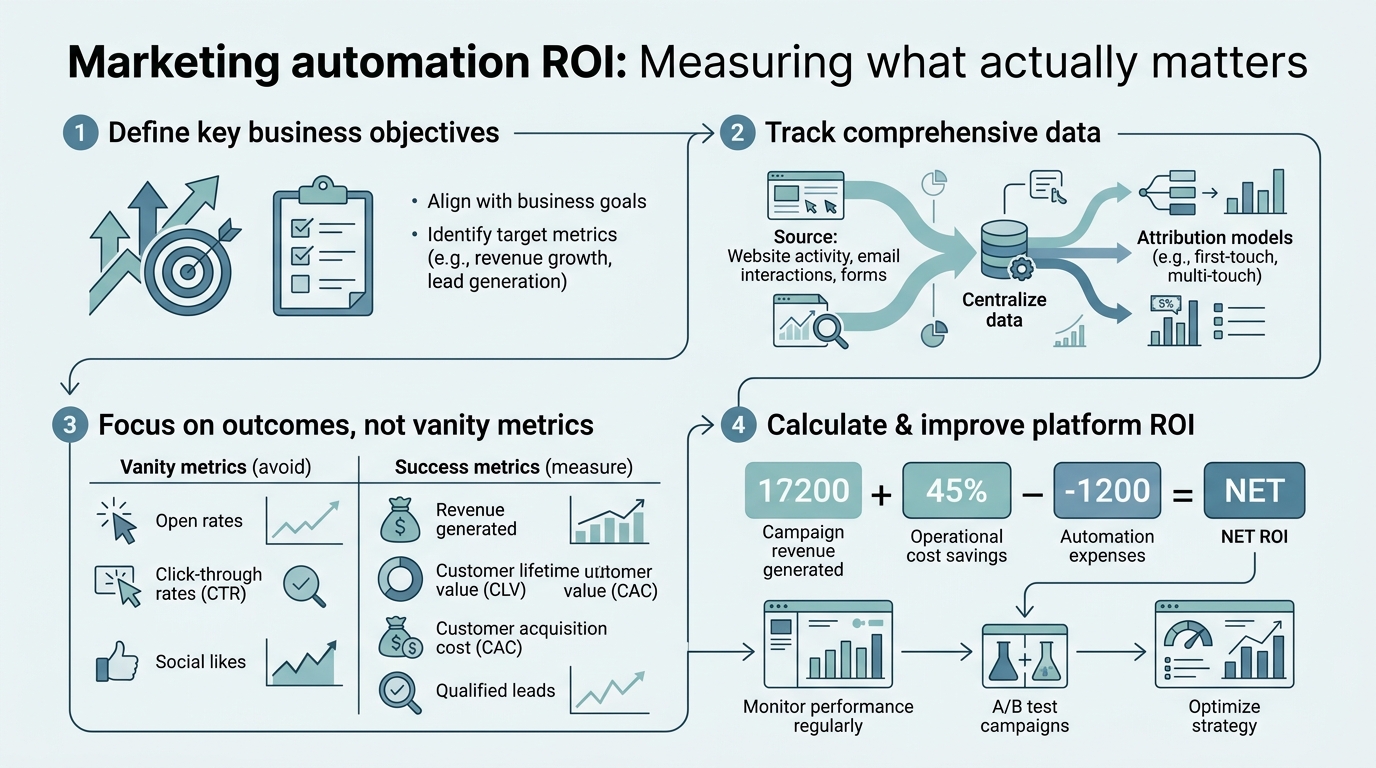
The primary reason teams struggle with ROI measurement isn't a lack of datait's the absence of a framework that separates signal from noise. Qualified leads increase by 451% under automation, but if you're not tracking which leads convert and at what customer acquisition cost, that 451% doesn't tell leadership anything about profitability. Most teams measure what's easy (email engagement, leads generated) instead of what matters (revenue closed, cost per acquisition, retention impact).
The Vanity Metric Trap
Email open rates, click-through rates, and lead volume are often the first metrics marketed automation platforms highlight because they're simple to extract and look impressive in a dashboard. A team running nurture automation might see 300% more leads enter the pipeline and celebrateuntil sales reports that 70% of those leads were unqualified, cost per close increased, and the deal cycle actually lengthened. This is the vanity metric trap: inflated activity masking deteriorating business outcomes.
The fix is specificity. Replace "leads generated" with "marketing-qualified leads by source and scoring model," "conversion rate" with "conversion rate by lead source and customer lifecycle stage," and "open rate" with "opportunity progression rate"how many emails lead to actual pipeline movement.
Attribution Failure and The Cost Allocation Problem
A prospect receives five automated touchpoints over three months before a salesperson reaches out. Who gets credit: the initial form submission touchpoint, the nurture workflow, or the sales call? Most teams default to last-click attribution, which awards all credit to the final sales interaction. In reality, the automation system guided 80% of the journey. This misattribution splits the revenue gain between multiple teams, diluting perceived ROI and making it harder to justify continued investment. A proper ROI framework assigns credit based on actual influenceoften through multi-touch attribution models or even team-based contribution percentages.
The Five-Pillar ROI Framework: What to Actually Measure
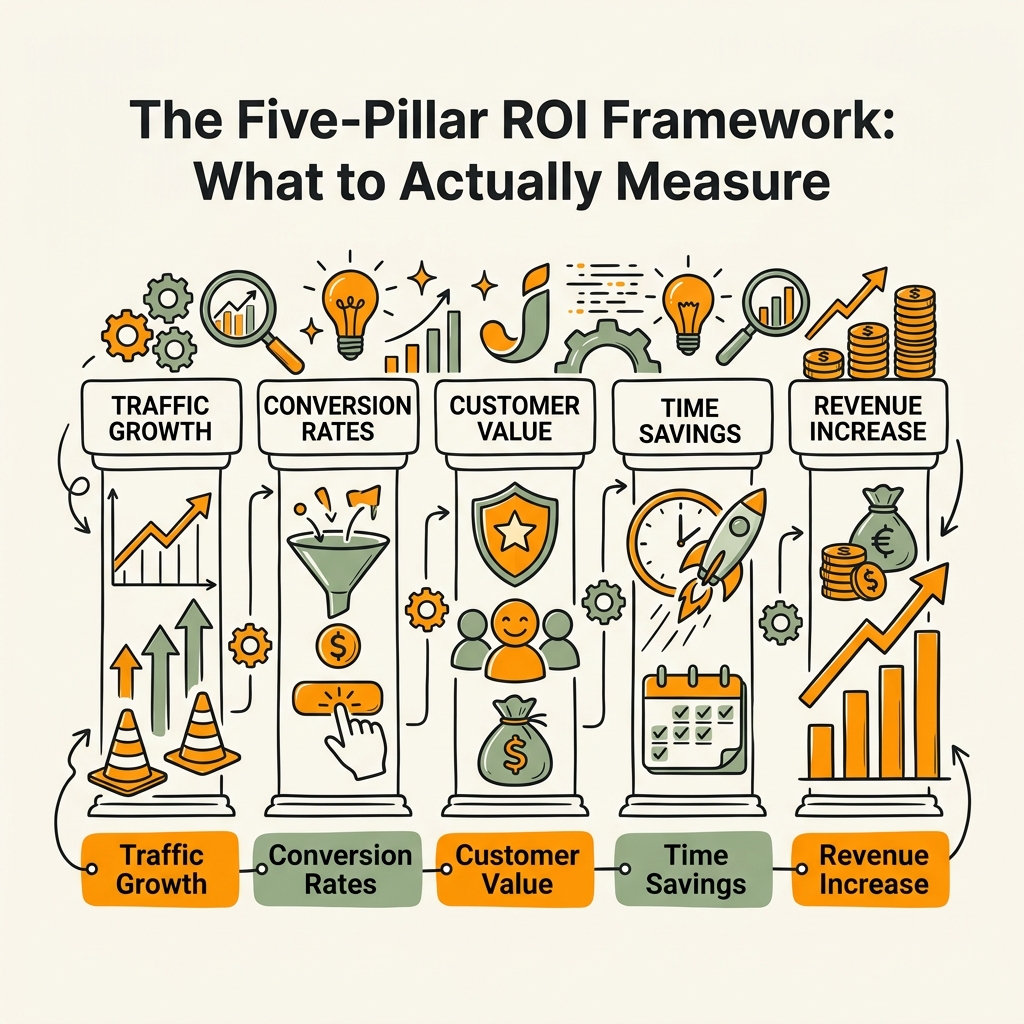
A comprehensive ROI calculation requires measuring five distinct value streams. Most teams focus only on the first pillar (financial return) and wonder why leadership remains unconvinced. The framework below captures the full picture: revenue generated, efficiency unlocked, team capacity freed, customer lifetime value, and brand equity. Together, these tell the complete ROI story.
Pillar One: Financial Return (Revenue and Conversion Impact)
This is the most straightforward pillar and the one leadership cares about most: direct revenue attribution. The average company attributes 34% of revenue growth directly to marketing automation. Your calculation should isolate revenue influenced by automated workflows, measure the velocity of deals through automated nurture pipelines, and compare customer acquisition cost before and after automation implementation.
To measure this properly, you'll need three data points: total new revenue closed from leads that passed through automation, the percentage of that revenue attributable to automation (use multi-touch attribution or a conservative estimate like 50-70% for companies beginning), and the cost to implement and run the platform. The formula is straightforward: (Attributed Revenue – Platform Cost) ÷ Platform Cost = ROI%. If your automation platform costs $5,000 per month ($60,000 per year) and you attribute $330,000 in annual revenue to automated workflows, your financial ROI is (330,000 – 60,000) ÷ 60,000 = 450%. That's a powerful number for a board presentation.
Pillar Two: Efficiency Gains and Operational Cost Savings
Before automation, your team manually triggered follow-up emails, copied lead information between systems, and logged call notes into multiple databases. Automation saves marketers an average of 2.3 hours per campaign, which across a team running 30+ campaigns per quarter compounds into weeks of freed time. Calculate the cost of this manual laborif one marketer spent 10 hours per week on repetitive tasks and earns $75,000 annually, that's roughly $14,400 per year in labor cost. When automation eliminates 80% of that work, you've created $11,520 in annual operational savings.
This pillar also captures hard infrastructure costs. Many companies build custom integrations between their email platform, CRM, and analytics systemoften costing $20,000-$50,000 in developer time. Modern automation platforms reduce integration overhead significantly, recovering that cost within 6-12 months. For growing companies managing multiple platforms, this efficiency pillar often accounts for 20-30% of total automation ROI.
Pillar Three: Capacity Freed and Opportunity Cost
When automation handles nurture workflows, lead scoring, and campaign deployment, your team shifts from execution to strategy. This is where your best talent can finally run A/B tests, optimize landing pages, build account-based campaigns, and experiment with new channels. If one marketer spends 15 hours per week on automation setup and maintenance, that's 780 hours per year lost to strategic work. Assign a conservative internal cost (25-50% of fully loaded salary for senior staff) to this opportunity cost.
A mid-level strategist at $85,000 total cost to the company loses roughly 19,500 hours of strategic potential per year to manual tasks ($85,000 × 780 hours ÷ 2,080 hours = $31,875). Automation recovers even 50% of this capacity ($16,000 annually) represents real economic value that compounds over multiple years as your team builds repeatable processes. Many companies scaling their marketing operations use content marketing automation to unlock this capacitywhen your content pipeline is automated, your team stops building assets manually and starts optimizing strategy instead.
Pillar Four: Customer Lifetime Value and Retention ROI
77% of companies report higher conversion rates after implementing automation, but the compound impact on retention is often overlooked. Personalized, automated communication increases customer satisfaction, reduces churn, and drives repeat purchases. Automated personalization and nurture workflows don't just accelerate new customer acquisitionthey strengthen existing relationships.
If automation increases annual customer retention by 5%, and your average customer lifetime value is $50,000, then a customer base of 200 clients captures an additional $500,000 in lifetime value from that 5% improvement. Spread over five years, that's $100,000 in additional annual revenueall from retention, not new acquisition. This pillar is particularly powerful for SaaS and subscription businesses where retention directly impacts annual recurring revenue.
Pillar Five: Brand Lift and Indirect Effects
Consistent, timely, personalized communication builds brand trust. When a prospect receives a relevant, helpful email exactly when they're evaluating solutions, your brand equity rises. This isn't directly measurable in spreadsheets, but it compounds into referral rates, brand search volume, and lower customer acquisition cost. If your brand search volume increases 20% in the year after automation launch, or referral rate jumps from 8% to 12% of new customers, assign a conservative percentage of that growth to automation's role.
Many companies capture this informally: "We've noticed sales spends less time justifying our brand because the marketing sequences do it for them." Quantify that as reduced sales cycle time or lower customer acquisition cost, and you've monetized brand lift.
Calculating Total Costs: Where Hidden Expenses Hide
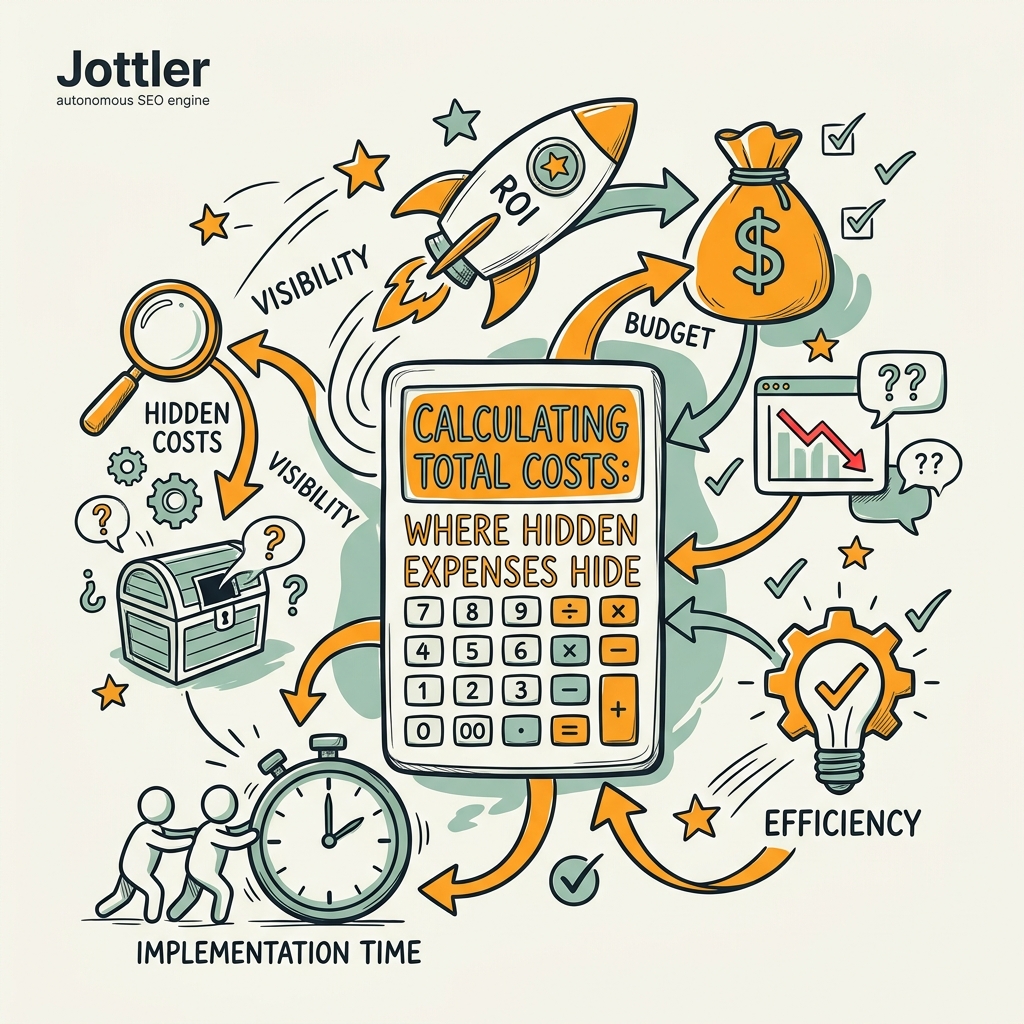
To avoid inflating ROI figures, capture every cost associated with automation implementation and maintenance. Most companies underestimate costs by 30-50%, which means their calculated ROI is equally inflated. Here's the complete cost hierarchy:
- Software subscriptions: Monthly or annual platform fees, including seats, features tiers, and integrations. Don't forget add-ons for advanced segmentation, predictive analytics, or compliance modules.
- Implementation and migration: Consultant or agency fees to design workflows, migrate data, set up integrations, and train staff. Budget $15,000-$75,000 depending on complexity.
- Integration and API costs: Native integrations with your CRM, analytics platform, and web infrastructure may require development work or third-party middleware.
- Personnel and training: Staff time to learn the platform, design campaigns, manage leads, and optimize workflows. Many companies allocate 0.5-1.5 FTE for ongoing platform management.
- Content and creative production: Email templates, landing pages, and nurture content don't write themselves. Budget $2,000-$10,000 monthly for professional copywriting and design if you're building quality assets.
- Reporting and analytics infrastructure: Custom dashboards, data warehousing, and analytics tools to track the metrics in Pillars One through Five often cost $500-$2,000 monthly.
A realistic first-year cost for a growing company: Platform ($6,000) + Implementation ($40,000) + Personnel (0.5 FTE = $35,000) + Content ($20,000) + Analytics ($8,000) = $109,000 total. If this captures $500,000 in attributed revenue, cost savings, and retained lifetime value, your year-one ROI is 358%still impressive, but far more honest than inflated projections.
Key ROI Metrics That Actually Drive Business Decisions
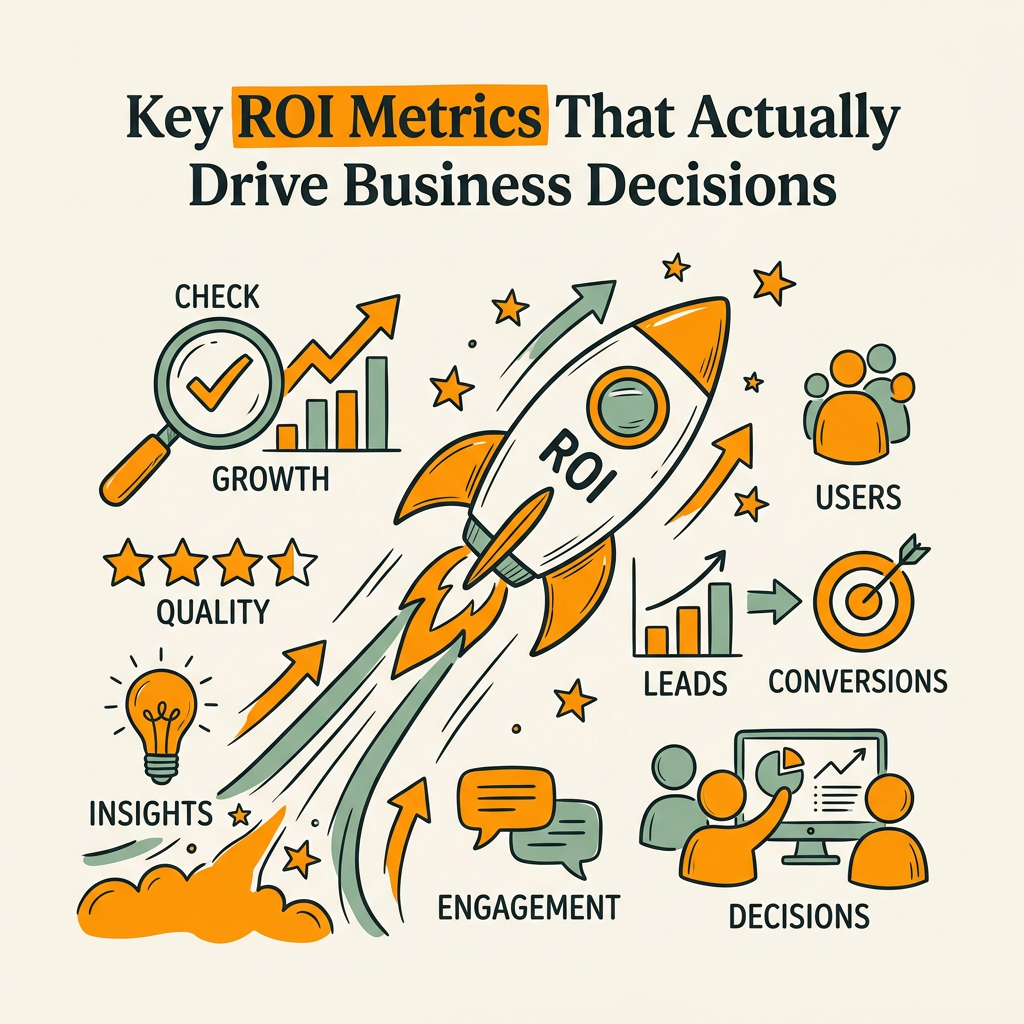
Move beyond vanity metrics to KPIs that correlate directly with revenue and profitability. These are the metrics that matter for a board presentation or quarterly business review.
Revenue-Centric Metrics
Track influenced revenue (total revenue touched by automated touchpoints), attributed revenue (revenue directly closed from automated workflows), customer acquisition cost by source (to ensure automation reduces CAC, not increases it), and average deal size for automation-influenced deals. If your automation platform cuts CAC from $2,500 to $1,800 while maintaining deal size, that's a 28% efficiency win with massive compounding impact.
Email automation deserves special attention. Automated emails generate $36 in return for every $1 spent, a 3,600% ROI that outperforms every other marketing channel. If your automation platform costs $6,000 monthly but drives even $100,000 annually in incremental email revenue, the channel alone justifies the investment.
Efficiency and Capacity Metrics
Track hours saved per marketer weekly (target: 8-15 hours), manual tasks eliminated (form filling, lead entry, email triggering), and time-to-close for automated vs. non-automated leads. If automation shrinks your sales cycle from 45 days to 35 days, that's worth $50,000-$150,000 in freed working capital per year. Some companies measure "campaigns executed per quarter with the same headcount"a 40% increase from automation is realistic and tied directly to automation tools that scale output.
Customer Health and Retention Metrics
Measure customer retention rate, customer satisfaction scores (NPS) for customers acquired through automation vs. traditional channels, expansion revenue (upsells and cross-sells to existing customers), and net dollar retention. If automation-influenced customers churn at 5% annually vs. 8% for non-automated cohorts, the lifetime value difference is massive. A $5,000 annual revenue customer with 5% churn has a lifetime value of ~$50,000; the same customer with 8% churn is worth ~$35,000. Scale that across 500 customers and automation's retention impact is worth $7.5 million.
Building the ROI Dashboard Leadership Actually Reads
Once you've identified and calculated these metrics across the five pillars, your job is communication. The majority of companieseven those with strong ROIfail to prove it because the measurement lives in a spreadsheet no one reads. A well-designed ROI dashboard should fit on one page and update monthly.
Your dashboard should show year-to-date revenue attributed to automation (big number, top left), efficiency gains in dollars (hours saved × loaded cost), retained customer lifetime value, total investment, and calculated ROI percentage. Include a quarterly trend line to show momentum. If ROI is climbing month-over-month, leadership stops questioning the investment.
Many growing companies compound their automation's effectiveness by pairing it with AI content strategy that ensures every automated workflow triggers with high-quality, personalized content at scale. When your automation platform triggers nurture campaigns with SEO-optimized assets that rank and convert, the content itself becomes part of your ROI storyhigher engagement, more qualified leads, stronger brand authority. Tools designed to automate the entire content pipeline, from research through publishing with internal linking, eliminate content bottlenecks that often limit automation effectiveness.
Simplicity is critical. A CFO doesn't need to understand email deliverability metrics or CRM field mapping. They need to see: "Automation investment of $109,000 generated $500,000 in attributed revenue, eliminated $75,000 in manual labor costs, and freed 1,500 marketing hours for strategy work. Total value: $575,000. ROI: 427%."
Common ROI Pitfalls and How to Avoid Them
Even with a solid framework, measurement errors can tank credibility. Here are the most common pitfalls teams encounter:
Over-Attribution and False Causation
Not every revenue win is automation's doing. A prospect might receive five automated emails but convert after a sales callis it 100% automation, 50%, or 20%? Define your attribution model before you start measuring. Most growing companies use either multi-touch attribution (credit distributed across all touchpoints) or a simplified model (marketing gets 50-70% credit for any deal that touched an automated workflow). Document your methodology and stick to it quarterlyconsistency beats perfect accuracy.
Ignoring the Cohort Effect
Customers acquired through automation aren't always comparable to historically-acquired customers. They might be smaller deals, longer sales cycles, or different industries. To isolate automation's true impact, compare cohorts: customers acquired in Q1 2025 (pre-automation) vs. Q2 2026 (post-automation). Hold variables constant: same sales team, same product pricing, same marketing budget. This eliminates false causation.
Sunk Cost Errors in Year Two
Your first-year automation ROI might be 250% because you invested $100,000 in implementation and software. In year two, you only spend $40,000 on software (implementation was a one-time cost). If you generate the same $330,000 in revenue, year-two ROI jumps to 725%. Document this clearlyyear two and beyond show much stronger returns because you're not re-amortizing setup costs.
Forgetting to Measure Negative Externalities
Sometimes automation creates problems: poor email list hygiene from over-sending, unsubscribes from irrelevant workflows, or sales alienation if marketing automations interfere with sales processes. Measure email unsubscribe rates, spam complaints, and sales team satisfaction. If automation increases unsubscribes by 5%, that's a negative ROI factor. The best automation platforms are designed to prevent this through intelligent segmentation and preference management.
Conclusion
Marketing automation ROI isn't a single metricit's a system. Most teams measure the easy stuff (email opens, leads) and miss the value that matters (revenue, retention, freed capacity). Companies that use a five-pillar framework capture 40-60% more value from automation than those measuring only financial return. The payback period for most implementations is under six months, meaning every month you delay proper measurement is a month of unquantified value left on the table.
Start with the five pillars: financial return, efficiency gains, capacity freed, customer retention, and brand lift. Capture all costs honestly, not just software fees. Build a simple dashboard that updates monthly. And most importantly, define your attribution model before you start measuringconsistency matters more than perfection.
If you're struggling to scale your marketing operations to keep up with automation's demands, Jottler can eliminate the bottleneck. By automating content research, writing, and publishing at scale, you ensure that every automated workflow has high-quality, personalized content that drives higher engagement and conversion. This compounds your automation ROI significantlyyou're not just automating distribution, you're automating the asset creation that makes distribution effective.
Start your SEO agent and turn your marketing automation investment into measurable revenue growth.
FAQs
How do I calculate marketing automation ROI?
Use the formula: ROI = (Total Return – Total Cost) ÷ Total Cost × 100. Total return includes attributed revenue, efficiency gains (hours saved × cost), and retained customer lifetime value. Total cost captures software subscriptions, implementation, integration, personnel, content, and analytics. For example, if automation generates $330,000 in attributed revenue and $75,000 in operational savings, with a total platform investment of $60,000, your ROI is ($405,000 – $60,000) ÷ $60,000 = 575%. The key is measuring all five value pillars, not just revenue.
What is a good ROI for marketing automation?
The industry benchmark is $5.44 return for every $1 spent, or 544% ROI over three years. Most companies achieve positive ROI within 6-12 months. A year-one ROI of 300-400% is strong; anything above 250% justifies continued investment. Companies with mature automation setups (2+ years) often see 600%+ ROI because they've eliminated first-year implementation costs and optimized workflows. The benchmark varies by industrySaaS and high-touch sales teams typically see higher ROI than retail or low-touch models.
What metrics matter most for proving automation ROI to leadership?
Focus on three metrics: attributed revenue (the biggest number), cost per acquisition (trending lower is proof of efficiency), and customer lifetime value from automation-influenced cohorts (compound value over time). Skip email open rates and lead volumethose are activity metrics, not outcomes. Leadership cares about revenue impact and cost reduction. Bundle these into a one-page monthly dashboard: top-line revenue influenced, total investment, and calculated ROI percentage. Trending this metric month-over-month is far more persuasive than a single quarter snapshot.