Setting Up Real-Time SEO Dashboards Without Manual Updates
Most marketing teams waste 5–10 hours per week manually updating spreadsheets with SEO metrics. Google Search Console data arrives 1–3 days late. Rank trackers require daily exports. Traffic trends hide in disconnected tools. The result: you're making decisions on stale data while competitors monitor their performance in real time.
The fix is simpler than you think. A properly configured SEO dashboard eliminates manual reporting entirely, pulling data automatically from Google Search Console, Google Analytics 4, rank tracking, and technical audit tools. Teams using automated dashboards save 10+ hours weekly while gaining same-day visibility into ranking changes, traffic shifts, and technical issues that matter.
Here's how to build and maintain a real-time SEO dashboard that updates itself.
Key Takeaways
- 77% of teams still rely on manual SEO reporting, costing them 5–10 hours per week that could go toward strategy. (2025, Industry Benchmark)
- Real-time dashboards combine Google Search Console, GA4, rank tracking, and technical audits into a single automated view with hourly to 24-hour refresh cycles.
- Automated dashboards cut setup friction by 60% when you choose the right tool stack—no developer required to build custom connectors.
- Unified Data Aggregation: Pull rankings, traffic, CTR, impressions, and technical health from 4–6 sources without manual export-paste cycles.
- Alert-Driven Monitoring: Automated thresholds trigger notifications for ranking drops, traffic spikes, and indexing issues—no daily dashboard review needed.
- Hourly Refresh Cadence: Most practical teams use hourly to 24-hour refreshes because Google data inherently lags 1–3 days, so true real-time is impossible but near-real-time is standard.
- Zero-Code Dashboard Builder: Tools like Looker Studio and specialist SEO reporting platforms eliminate the need for custom development or data engineers.
- Segmented Performance Tracking: Breaking down metrics by device, traffic type, content pillar, and intent reveals what's driving growth or decline far better than totals.
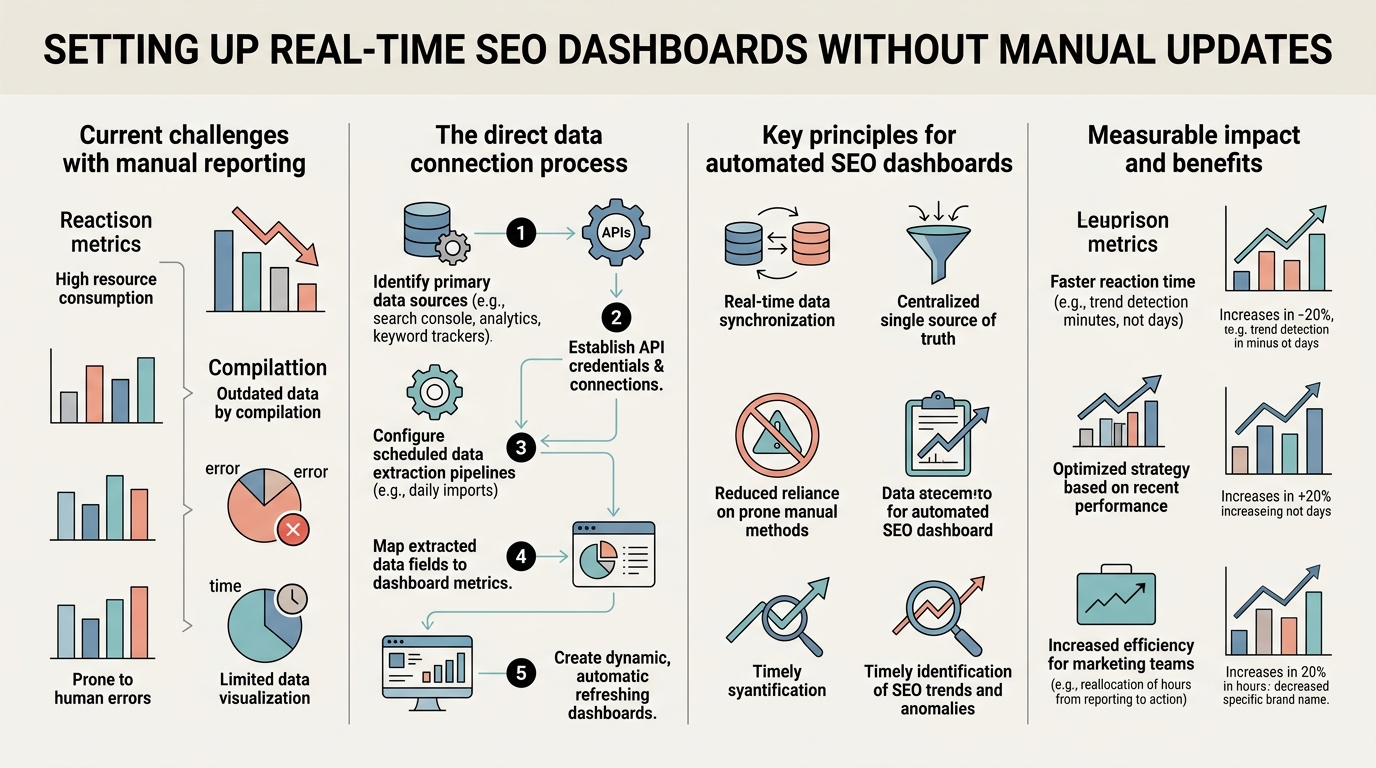
Why Manual SEO Reporting Breaks Down at Scale
Manual reporting works fine for a single site with 50 keywords. Once you scale to multiple properties, content clusters, or client portfolios, the spreadsheet approach becomes a bottleneck. You're copying data from Google Search Console, pasting it into a spreadsheet, manually calculating week-over-week changes, then sending static PDFs that are outdated the moment they land in a client's inbox.
35% of SEO labor costs come from manual tasks that automation could eliminate entirely. Most of that time goes to data compilation, not analysis or strategy. When you're managing hundreds of pages across multiple properties, the friction multiplies exponentially. That's where automated SEO workflows become essential—not just for content production but for performance monitoring too.
"The best teams consolidate these feeds into one dashboard. No tab-switching. One view shows rankings, CTR, traffic trends, top-performing pages, technical health, and trend alerts simultaneously. That consolidated view is where insights live." — SEO Operations Lead, SaaS Marketing Team
The Hidden Cost of Stale Data
Google Search Console refreshes every 1–3 days. Google Analytics processes most data with a 24–48 hour delay. By the time your spreadsheet report lands on Friday, Wednesday's traffic anomalies are ancient history. A ranking drop that happened Tuesday might not show in your data until Thursday. If that drop was caused by a technical issue or algorithm update, waiting five days to notice costs you 20% of that week's organic sessions—irretrievable revenue.
Automated dashboards with hourly or daily refresh catch these anomalies the same day they happen. That speed is the only real competitive edge when outranking competitors matters.
Tool Fragmentation Destroys Workflow Efficiency
The typical SEO manager uses 5–7 tools: Google Search Console, GA4, a rank tracker, a technical audit tool, a backlink tracker, possibly a content optimization tool, and something for competitive analysis. Switching between seven browser tabs to compile a single metric is not analysis—it's data janitor work.
The best teams consolidate these feeds into one dashboard. No tab-switching. One view shows rankings, CTR, traffic trends, top-performing pages, technical health, and trend alerts simultaneously. That consolidated view is where insights live.
How to Select the Right Dashboard Architecture for Your Team

The right dashboard depends on three factors: team size, technical capacity, and budget. You can build a custom dashboard using Looker Studio and APIs (free, requires some setup), adopt a specialist SEO reporting tool like Databox or SE Ranking ($99–$199/month), or use an all-in-one SEO platform like Semrush or Ahrefs that includes reporting. Each has trade-offs in automation depth, ease of setup, and cost.
The strategy you choose for dashboarding should align with your broader content marketing automation approach. If you're publishing multiple articles daily through automated systems, your dashboard needs to track performance at that velocity. Manual dashboard maintenance won't keep pace.
"Once you move beyond 10,000 monthly impressions, manual spreadsheets become a liability. Real-time dashboards let teams respond to traffic shifts within hours instead of waiting for Friday reports. That's the difference between defending market share and losing it." — Director of Organic Growth, B2B SaaS Company
The Custom Stack: Looker Studio + Google APIs
Looker Studio (Google's free data visualization tool) connects directly to Google Search Console and Google Analytics 4. It requires manual setup of data source connectors, but once configured, the dashboard updates automatically whenever GSC and GA4 update. You can add rank tracking data by exporting CSVs from your rank tracker weekly and importing them via Coupler.io or a similar connector service.
This approach is ideal for teams comfortable with light configuration work but zero coding. Cost is essentially free except for optional paid connectors. The trade-off: you're managing multiple data sources manually, and GSC data still arrives on its native 1–3 day lag. Add-on costs mount quickly if you layer in rank tracking imports and technical audit data.
Specialist Reporting Tools: AgencyAnalytics, Whatagraph, DashThis
These platforms exist specifically to pull SEO data from multiple sources and display it automatically. They handle the connector plumbing for you. Connect your GSC, GA4, rank tracker, and technical audit tool once, and the tool refreshes all of them on a schedule you set (hourly to daily). Most include white-label dashboards for agencies and clients, automated PDF scheduling, alert thresholds, and custom KPI cards.
AgencyAnalytics ($99–$149/month) focuses on SEO-heavy reporting with strong white-label features. Whatagraph ($129–$199/month) automates multi-channel reporting and is praised for speed and polish. DashThis ($39–$99/month depending on plan) is simpler and lower-cost but less SEO-specialized. These tools cut setup time to 15–30 minutes and remove the ongoing data maintenance burden.
All-in-One SEO Platforms: Semrush, Ahrefs, SE Ranking
If you already use Semrush or Ahrefs for keyword research, backlink analysis, and technical audits, their reporting dashboards are included. Rank tracking, content audits, and competitor data live in the same system as reporting. No external connectors needed. The downside: you're paying for a complete SEO suite even if you only need reporting, and the reporting features are secondary to the platform's core tooling.
SE Ranking ($99/month) is the exception—it's an affordable all-in-one platform built for small businesses and lean teams, and its reporting is as capable as much pricier competitors.
The Core Data Sources Every Real-Time Dashboard Must Include
A mature SEO dashboard pulls from at least 4–6 core sources. Each feeds a different dimension of performance: search visibility, traffic quality, engagement, conversions, and technical health. Missing even one creates blind spots.
Google Search Console: Impressions, CTR, and Ranking Position
GSC is your primary source of truth for search performance. It shows which keywords bring impressions, average CTR by query, average position, and whether Google can crawl and index your pages. Most dashboards track GSC data by query, landing page, or content cluster to identify which topics and pages drive the most search traffic.
GSC data refreshes every 1–3 days, so "real-time" GSC dashboards are really near-real-time. Configure your dashboard to refresh daily at 6 a.m. so you see the previous day's data each morning. For agencies managing multiple client sites, GSC connectors in tools like Whatagraph can aggregate all client accounts into one dashboard automatically.
Google Analytics 4: Traffic Quality and User Behavior
GA4 shows traffic volume, sessions, bounce rate, average session duration, and conversions. It tells you whether your search traffic actually engages with content or bounces immediately. A page with 10,000 impressions but 80% bounce rate is not a win—it's a top-of-funnel problem.
GA4 offers limited real-time data for select metrics, but standard reports lag 24–48 hours. Most dashboards pull GA4 data daily to align with GSC reporting. Segment GA4 by channel (organic), device (mobile vs. desktop), and landing page to expose which content segments drive conversions.
Rank Tracking: Position Monitoring and Competitor Movement
Track your rankings on your target keywords daily or twice daily. Most SEO managers find 2x daily (morning and evening) is sufficient because keyword positions generally don't shift hour-to-hour like traffic spikes do. Rank tracking tools like Semrush, SE Ranking, or Mangools integrate directly into automated dashboards.
The best rank dashboards show position changes day-over-day, movement in the past 30 days, and percentage of keywords in each position bucket (top 3, top 10, 11–20, etc.). Set alerts to trigger if more than 5% of your keywords drop more than 3 positions in a single day—that's usually a signal of a technical issue or algorithm shift worth investigating immediately.
Technical Audit Data: Crawlability and Core Web Vitals
Your dashboard should flag when your site develops crawl errors, SSL/TLS issues, mobile usability problems, or Core Web Vitals regressions. Tools like Screaming Frog, Sitebulb, or ContentKing integrate with dashboards to show technical health metrics. Many dashboards set critical alerts for indexability problems because a sudden spike in crawl errors usually precedes a traffic drop.
Technical audit data refreshes daily or weekly depending on tool. For fast-moving sites, daily crawl audits are worth the cost because they catch indexation issues before they tank rankings.
Optional: Backlink and Competitive Data
Some dashboards include backlink acquisition trends and competitive visibility. If you're managing an SEO program across multiple content clusters or competitive niches, tracking your share-of-voice against competitors provides context. Did your traffic drop because of your own issues, or because competitors are outranking you?
Backlink and competitive data is lower priority than traffic and ranking data, so include it only if your tool supports it at no extra cost.
Configuring Automated Refresh Schedules and Alerts
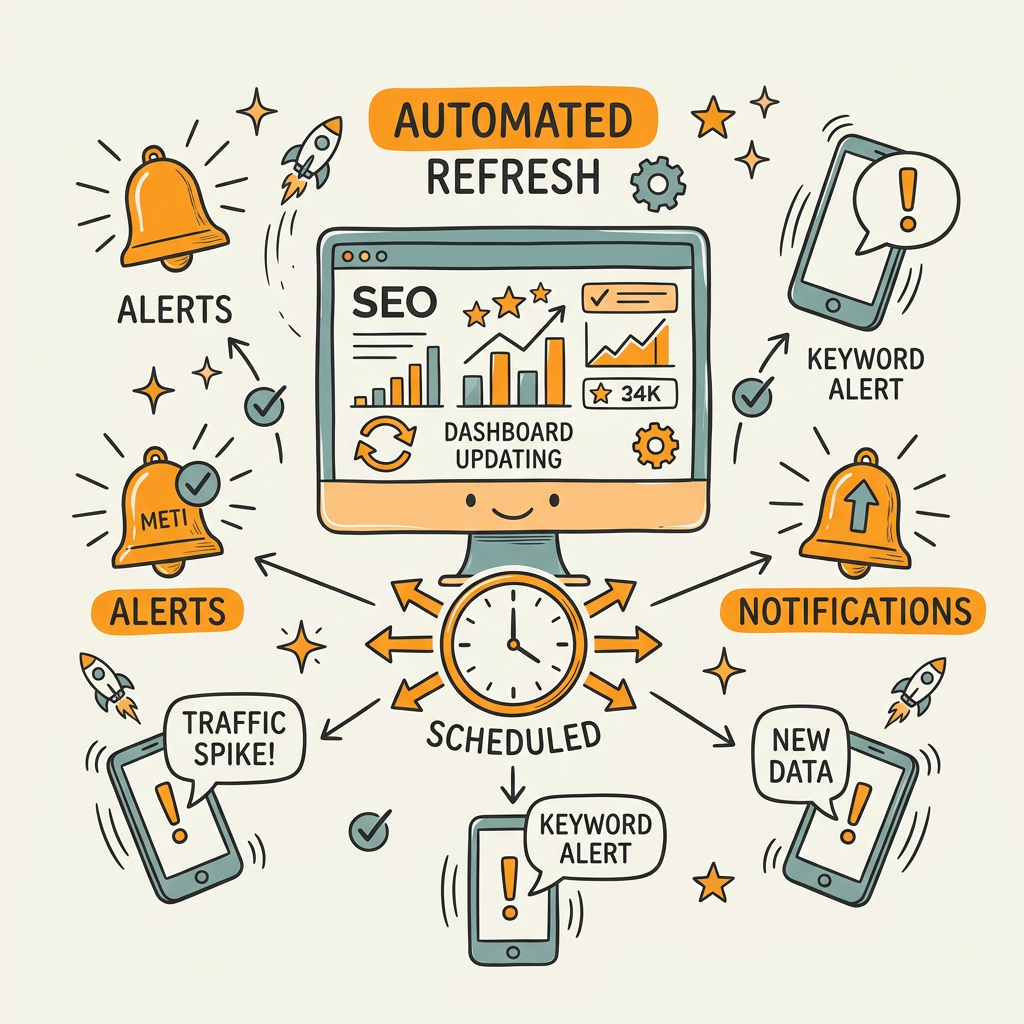
The difference between a static dashboard and a real-time dashboard is automation. You set it up once and it runs without manual intervention. The key is choosing the right refresh cadence and alert thresholds for your workflow.
Hourly vs. Daily vs. Weekly Refresh: What Actually Makes Sense
Hourly refresh is the gold standard for detection speed, but it only matters if you can act on alerts the moment they fire. For most teams, an hourly dashboard check isn't realistic. A more practical cadence is daily refresh early in the morning (6 a.m.) so you see the previous day's data and can react before the business day ends. Rank tracking can refresh 2x daily because positions move more slowly. Technical audits refresh daily or weekly.
Set up your dashboard refresh schedule to align with your team's response capability. If no one checks the dashboard until Monday morning, hourly refresh wastes API calls. Daily is more practical for most teams. Some aggressive performance marketers run hourly dashboards and set aggressive alerts that page team members the moment significant anomalies occur.
Alert Thresholds: Critical, Warning, and Informational Tiers
Not all alerts are equally important. A 1% traffic dip is noise. A 20% traffic drop in a single day is a crisis. Set up tiered thresholds:
- Critical: Traffic drop exceeding 15%, crawl error spike, or indexation failure. Alert immediately (SMS or Slack ping).
- Warning: Ranking loss of 5+ positions for top 10 keywords, 5–15% traffic variance, Core Web Vitals decline. Daily email digest.
- Informational: New backlinks, competitors gaining visibility, or positive traffic trends. Weekly summary report.
Adjust thresholds for seasonality and normal volatility. If your site experiences 20% traffic swings on weekends versus weekdays, set weekend thresholds higher so alerts don't fire constantly.
Avoiding Alert Fatigue: Less Noise, More Signal
Too many alerts desensitize teams to real problems. If your dashboard fires 50 alerts per week, you'll ignore 49 of them. The best practice is to start conservative (only critical alerts enabled) and adjust based on what actually matters to your business. Some teams care deeply about ranking position. Others care only about traffic and conversions. Configure alerts to match your priorities.
Building Dashboard Visualizations That Drive Action
Data visibility without interpretation is just noise. The best dashboards surface three questions: What changed? Why did it change? What should we do about it?
Trend Visualizations: Spot Pattern Breaks Immediately
Line charts showing organic traffic, impressions, and average position over 30 days reveal patterns and anomalies visually. A flat line that suddenly spikes or drops catches the eye instantly. Use color coding: green for trending up, red for trending down, gray for flat. Pair trend lines with day-over-day and month-over-month percentage changes so your team understands the magnitude of change at a glance.
Segmented Performance Tables: Mobile vs. Desktop, Branded vs. Non-Branded
A single traffic number hides real insights. Break down organic traffic by device type, branded vs. non-branded queries, and content pillar or page type. A scenario: overall traffic is flat, but mobile traffic dropped 18% while desktop grew 5%. That's a mobile usability problem that a single total would never reveal.
Similarly, segment rankings by position bucket (top 3, top 10, 11–20). If 40% of your keywords are in the top 10 and that percentage dropped to 30% this month, you have a meaningful ranking regression even if your top 5 positions stayed stable.
KPI Scorecard: The CEO's View
At the top of your dashboard, place a KPI scorecard showing the metrics that tie directly to revenue: organic traffic, conversions from organic, revenue per session, new leads, or whatever matters to your business. Show the current period vs. the previous period and year-over-year change. This gives non-technical stakeholders the insight they care about without data overwhelm.
Avoiding Common Real-Time Dashboard Pitfalls
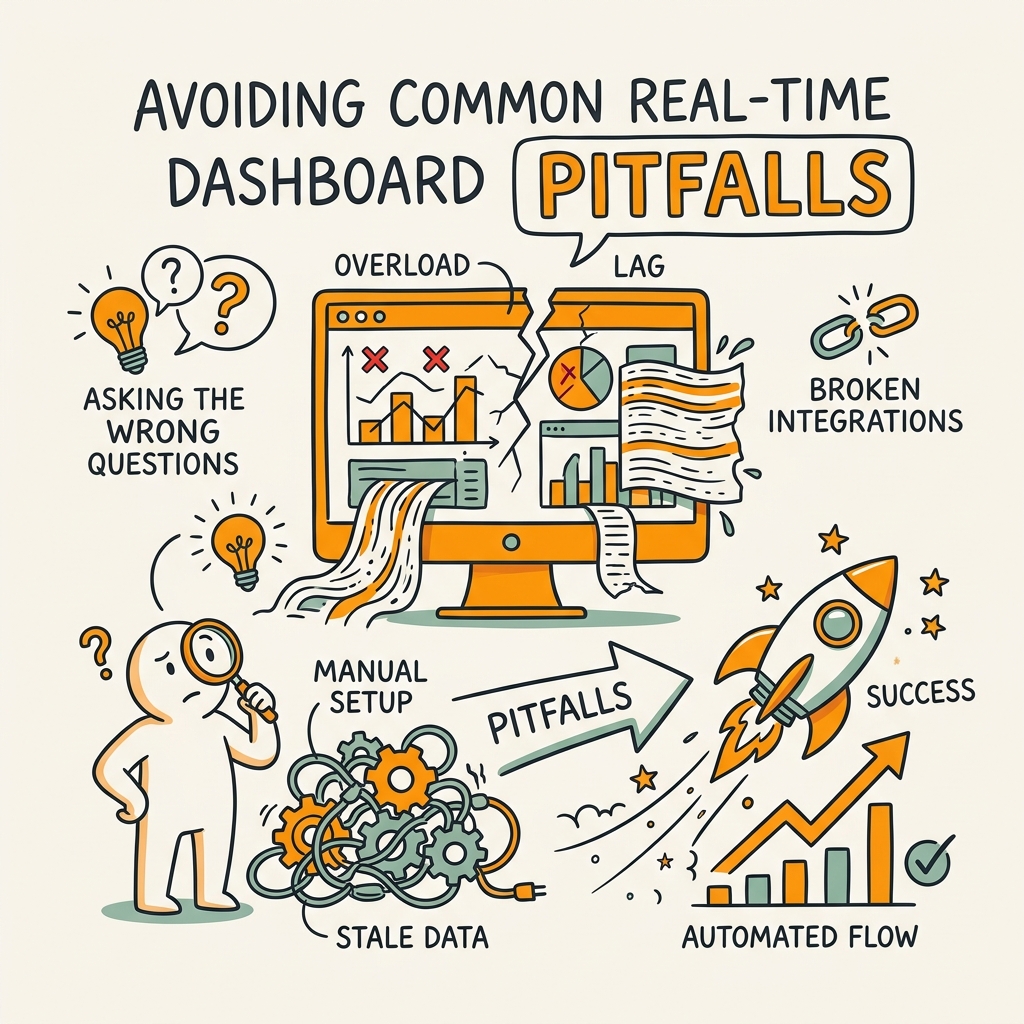
Most teams set up a dashboard and then let it decay. Data sources break. Alerts stop firing. The dashboard becomes a museum piece nobody checks. Here's how to keep it operational.
Monitor Data Connector Health Daily
Your dashboard is only as good as its data sources. A broken GSC connector silently stops updating your rankings. A failed GA4 data export leaves a gap. Set up daily health checks: verify that each data source updated in the last 24 hours. If Jottler or other automated content tools feed data into your dashboard, confirm those pipelines are active too.
Most reporting tools have a "data last updated" timestamp visible on the dashboard. Check it every morning. If a source hasn't updated in 48+ hours, investigate the connector before trusting your data.
Reconcile Dashboard Data Against Primary Sources Quarterly
Automated data sometimes drifts. A dashboard might show 50,000 impressions while Google Search Console shows 48,000 because of data processing delays or connector quirks. Quarterly, pull raw GSC and GA4 data directly and compare it against your dashboard totals. If they diverge more than 5%, investigate the data source or connector settings.
Adjust Thresholds as Traffic Scales
Your alert thresholds should evolve as your organic traffic grows. When you had 1,000 monthly sessions, a 100-session drop warranted a critical alert. When you reach 100,000 monthly sessions, a 100-session drop is noise. Revisit alert thresholds every quarter as your traffic scales.
Scaling Dashboards for Multiple Sites and Teams
Single-site dashboards are simple. Multi-site or multi-client dashboards require more structure.
Dashboard Architecture for Agencies and Multi-Site Operations
If you manage multiple client sites or properties, your dashboard stack needs hierarchy. Create a master dashboard showing aggregate metrics across all properties. Then create individual client/property dashboards for deep dives. Each client dashboard should show their specific rankings, traffic, technical health, and conversions isolated from others.
Most specialist reporting tools like Whatagraph handle this with team/account hierarchies. You set user permissions so clients see only their data and team members see cross-client aggregates. For teams building content at scale with an autonomous SEO agent that publishes hundreds of articles, this multi-property architecture becomes essential for tracking which content clusters and topics drive the most traffic.
Permissions and Access Control
Protect sensitive data. Clients should see their own metrics but not competitors' data. Executives should see KPIs but maybe not hourly anomalies. Set granular permission levels in your dashboard tool so each user sees only what they need to act on.
Documentation and Ownership
Assign a dashboard owner on your team. That person maintains connector health, adjusts alert thresholds, and troubleshoots data issues. Without clear ownership, dashboards become orphaned—alerts stop firing and nobody notices data breaks.
Comparison: Custom Dashboard vs. Specialist Tools vs. All-in-One Platforms
| Factor | Custom Stack (Looker Studio) | Specialist Tool (Whatagraph, DashThis, AgencyAnalytics) | All-in-One Platform (Semrush, SE Ranking) |
|---|---|---|---|
| Setup Time | 2–4 hours; requires connector configuration | 15–30 minutes; pre-built connectors | 30 minutes; no additional setup |
| Ongoing Maintenance | Moderate; manual data imports and connector troubleshooting | Minimal; tool handles refreshes automatically | Minimal; vendor handles maintenance |
| Monthly Cost | $0–50 (optional paid connectors) | $99–199 (AgencyAnalytics, Whatagraph, DashThis) | $99–299 (depends on platform tier) |
| Data Sources Supported | 4–6 (GSC, GA4, manual imports) | 6–10 (GSC, GA4, rank tracking, technical audit, backlinks) | 10+ (all tools built into platform) |
| White-Label Support | Not available | Yes (AgencyAnalytics, Whatagraph) | Limited (usually premium tier only) |
| Customization Depth | Very high; build any visualization you want | Moderate; template-based with limited custom fields | Low; pre-built reports with limited customization |
| Best For | Teams comfortable with data configuration; single-site focus | Agencies, multi-client shops, teams wanting automation without coding | Teams already using the platform; want reporting integrated |
For most busy founders and marketing teams, a specialist reporting tool like Whatagraph or AgencyAnalytics hits the sweet spot: they're faster to set up than custom stacks, cheaper than all-in-one platforms, and more SEO-focused than generic BI tools. They handle the connector plumbing you don't want to manage yourself. However, if you're scaling a content marketing program built on AI-generated articles, a real-time dashboard feeding back into your content strategy creates a powerful feedback loop.
Conclusion
Real-time SEO dashboards eliminate the time sink of manual reporting while accelerating decision-making. Teams using automated dashboards save 10+ hours per week and catch ranking drops, traffic anomalies, and technical issues the same day they occur—instead of five days later when reviewing a spreadsheet.
The setup path is straightforward: choose your data sources (GSC, GA4, rank tracking, technical audit), select a dashboard tool (custom Looker Studio, specialist platform like Whatagraph, or all-in-one SEO suite), configure refresh schedules (hourly to daily), and set alert thresholds. Once live, the dashboard runs itself. Your team checks it each morning and reacts to anomalies with real data instead of yesterday's guesses.
The strongest performing teams combine automated dashboards with automated content production. Your dashboard performance data becomes the feedback mechanism for content decisions, creating a compounding growth system that manual workflows can't match.
Start your SEO agent to begin automating both content production and performance tracking that drives strategy.
FAQs
What does real-time mean for SEO dashboards?
True real-time (instantaneous) is impossible for SEO dashboards because Google Search Console data arrives 1–3 days after events occur, and Google Analytics processes most reports with a 24–48 hour delay. Near-real-time means hourly to daily automated refreshes, so you see today's performance tomorrow morning instead of waiting five days for a manual spreadsheet. Hourly refreshes catch same-day anomalies like traffic spikes or ranking drops, while daily refreshes align with the natural lag of search data sources. For most teams, daily refresh at 6 a.m. is the practical sweet spot—you see the previous day's data each morning and can act before the business day ends.
How often should a SEO dashboard refresh?
Refresh frequency depends on your team's ability to respond and the data source's update pattern. Daily refresh (typically at 6 a.m.) is standard practice because it aligns with GSC and GA4 data delays and gives teams a single morning checkpoint. Rank tracking can refresh 2x daily since keyword positions move slower than traffic spikes. Technical audits refresh daily or weekly. Some aggressive performance teams run hourly dashboards paired with automated alerts that notify the team of critical issues (20%+ traffic drops, severe ranking losses) immediately. Start with daily refresh and move to hourly only if your team has the capacity to respond to real-time alerts without alert fatigue.
Do I need a developer to build an SEO dashboard?
No. Specialist reporting tools like Whatagraph, DashThis, and AgencyAnalytics are designed for non-technical teams and require zero coding—just connect your data sources and customize layouts from templates. Setup takes 15–30 minutes for most teams. If you prefer extreme customization and have some technical comfort, Looker Studio is free and can be configured by anyone familiar with spreadsheets. An all-in-one SEO platform like Semrush or SE Ranking includes reporting dashboards built-in with no additional setup. The only scenario requiring a developer is if you're building a highly customized internal analytics system pulling from many sources—and most teams don't need that complexity.