Site Speed and Core Web Vitals: Impact on Rankings
Only 47% of websites currently pass Google's Core Web Vitals assessment, yet most marketers still treat site speed as optional. The truth is sharper: Core Web Vitals are now a confirmed ranking factor, meaning slow pages lose visibility to faster competitors—even when content quality is identical. A 100-millisecond delay cuts conversion rates by 7%, and that performance penalty compounds across thousands of visitors. Here's the framework to audit, optimize, and sustain the speed your rankings depend on.
Key Takeaways
- Only 47% of websites pass Core Web Vitals, and 62% of mobile pages still fail to meet good LCP thresholds (2025, Magnet)
- Google uses 75% of page loads meeting "good" thresholds across all three metrics (LCP, INP, CLS) to qualify for ranking eligibility (2026)
- Speed acts as a tie-breaker in competitive niches—when content quality is similar, faster pages rank higher
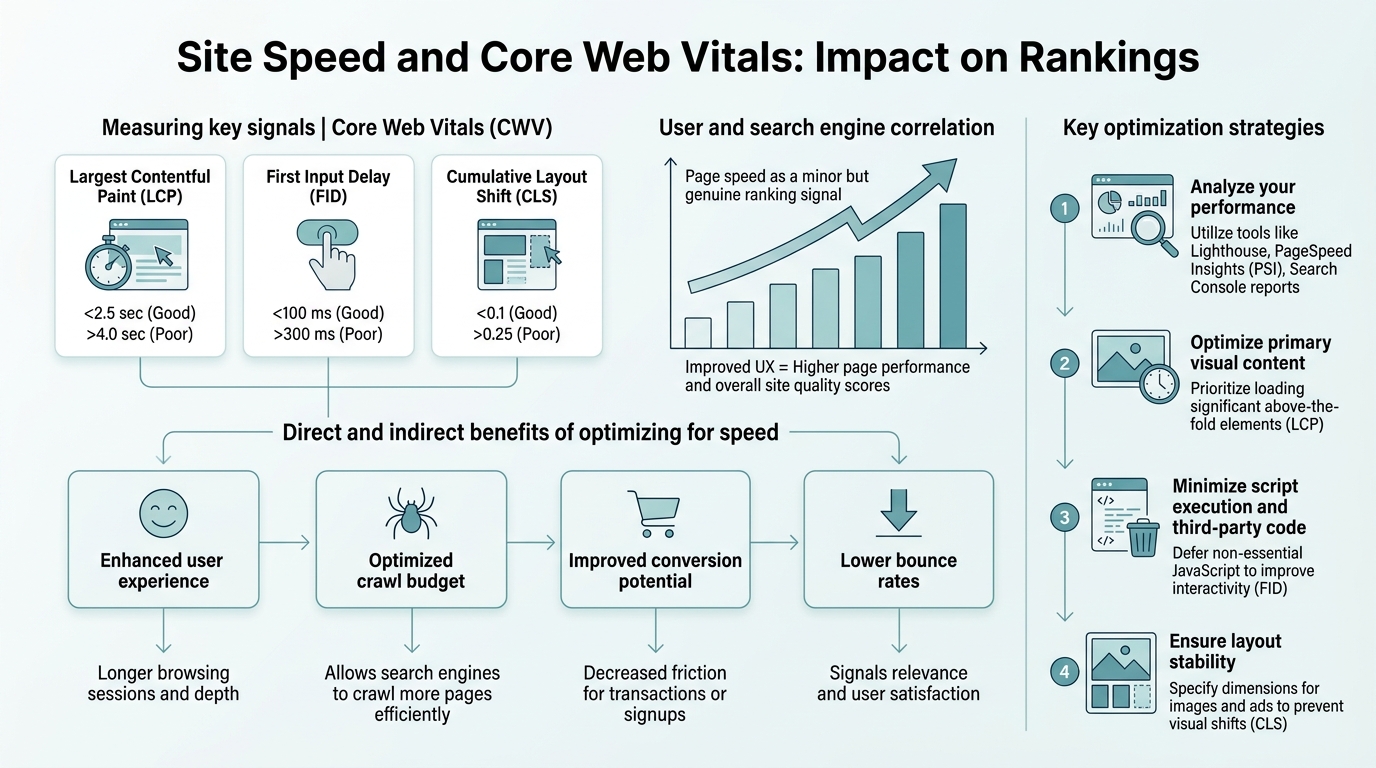
- Understanding Core Web Vitals and Their Ranking Weight: Google's three performance metrics (LCP, INP, CLS) measure real-user experience and act as a ranking signal; optimizing all three is essential for competitive keywords.
- Measuring Performance Against Thresholds: CrUX field data—not Lighthouse lab scores—determines ranking eligibility; 75% of page loads must meet "good" on all three metrics.
- Optimizing Largest Contentful Paint (LCP): LCP is the hardest metric to pass; server response, image optimization, and above-the-fold prioritization drive fastest gains.
- Reducing Interaction to Next Paint (INP): JavaScript responsiveness now matters for all interactions, not just the first; breaking up long tasks yields immediate improvements.
- Controlling Cumulative Layout Shift (CLS): Reserve space for images and ads to prevent layout jumps; this is the easiest metric to fix in 4–8 hours.
- Building Continuous Performance Monitoring: Automated alerts and pre-publish validation prevent regressions as you scale content production.
Understanding Core Web Vitals and Their Ranking Weight
Google confirmed in 2026 that Core Web Vitals are a confirmed ranking factor, part of the broader page experience signal used across search results. They measure three dimensions of real-world user experience: how fast the page loads, how responsive it is to user input, and how stable the layout is as content renders. The question isn't whether they matter—it's how much they matter relative to other signals.
The practical answer is nuanced. Core Web Vitals act most like a tie-breaker in competitive niches. If two pages address the same query with equally relevant content, and one page has better Core Web Vitals scores, Google favors the faster one. This effect is strongest on mobile, where speed differences are most felt and where the majority of searches now occur. On niche keywords with less competition, slow pages can still rank—but they start at a disadvantage.
"In dense, high-intent categories like e-commerce and SaaS, speed differences correlate directly with ranking position changes. Marketers working in these spaces cannot ignore Core Web Vitals without incurring a measurable ranking cost."
How Core Web Vitals Fit Into Google's Broader Ranking Algorithm
Google has consistently ranked Core Web Vitals as one of hundreds of ranking factors—not the primary one. Content relevance, authority, and backlink quality remain the foundation. But the competitive gap matters. In dense, high-intent categories (e-commerce, SaaS, finance, health), speed differences correlate directly with ranking position changes. Marketers working in these spaces cannot ignore Core Web Vitals without incurring a measurable ranking cost.
The shift to Core Web Vitals as a ranking factor reflects a broader Google philosophy: search results should prioritize pages that deliver good user experiences, not just relevant answers. This means optimizing for Core Web Vitals isn't just good for SEO—it's good for conversion rates, bounce rates, and mobile usability. Understanding this connection is critical when building SEO content plans that compound over time.
The Three Core Web Vitals Explained
Each of the three Core Web Vitals measures a different user-experience dimension:
- Largest Contentful Paint (LCP): How fast the largest image or text block appears on the page. Target: below 2.5 seconds.
- Interaction to Next Paint (INP): The latency between a user action (click, tap, keystroke) and the next visual response. Target: below 200 milliseconds. This metric replaced First Input Delay (FID) in 2024, making responsiveness to all interactions matter, not just the first one.
- Cumulative Layout Shift (CLS): How much the page layout shifts unexpectedly as content loads. Target: below 0.1. This metric prevents the frustration of clicking on a button, only to have the button move because an ad loaded above it.
Measuring Performance Against Thresholds: CrUX vs. Lighthouse
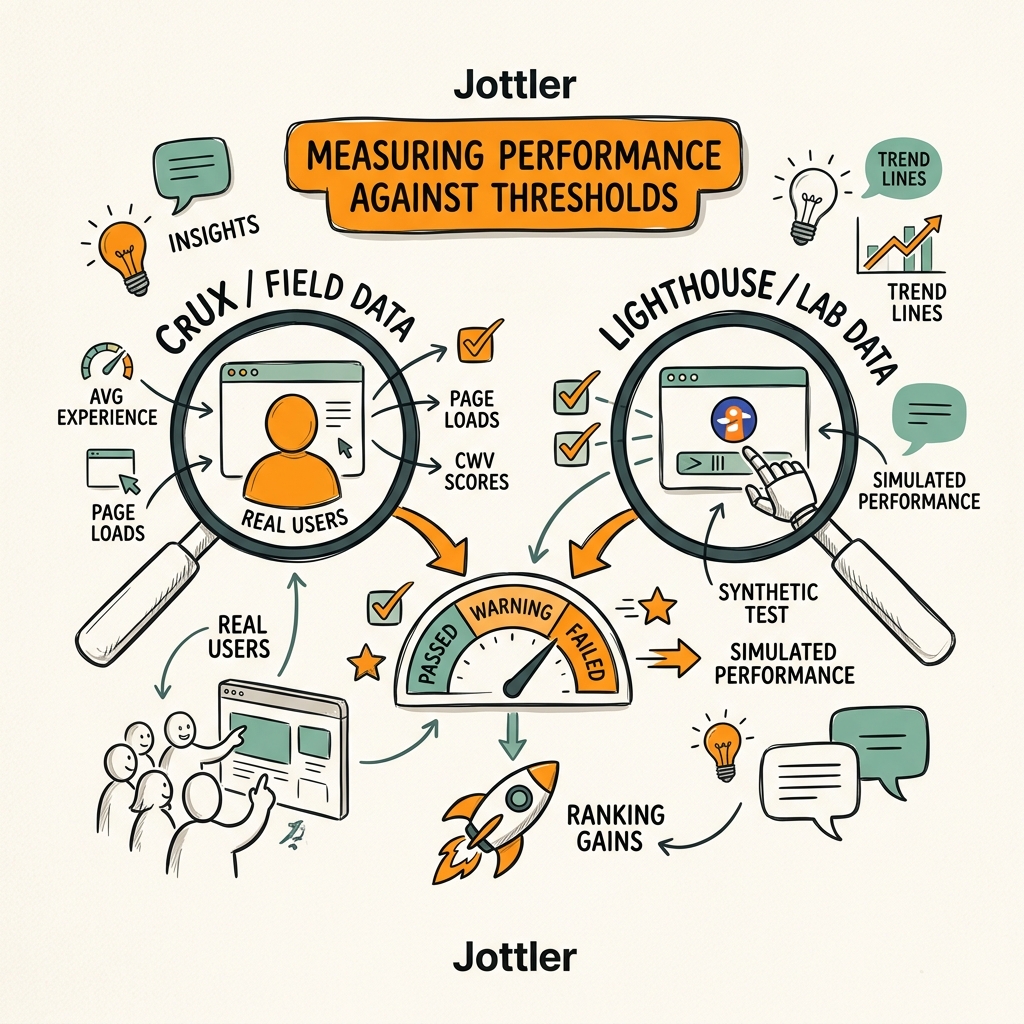
Most teams rely on Lighthouse lab scores, which is a mistake. Lighthouse simulates page performance in controlled conditions—useful for debugging, but not indicative of what real users experience. Google's ranking decisions use field data from the Chrome User Experience Report (CrUX), which aggregates real-user metrics from millions of devices and network conditions.
To qualify for a positive page-experience signal, 75% of your page's real-user loads need to meet "good" thresholds for all three Core Web Vitals. This is a high bar. It means that even if the average LCP is 2.3 seconds (good), if 30% of your traffic has LCP above 2.5 seconds, you won't pass the assessment.
"CrUX is the source of truth because it reflects how real users experience your site. Lighthouse is a tool for identifying technical causes and testing fixes in isolation. Use Lighthouse to understand why a page is slow, then track the fix in CrUX to confirm it moved the needle in production."
CrUX Data vs. Lighthouse: Which One Matters for Rankings?
CrUX matters for rankings; Lighthouse matters for debugging. CrUX is the source of truth because it reflects how real users experience your site. Lighthouse is a tool for identifying technical causes and testing fixes in isolation. Use Lighthouse to understand why a page is slow, then track the fix in CrUX to confirm it moved the needle in production.
Check your CrUX data in Google Search Console. Filter by device type (mobile typically shows slower performance) and by URL. The report will show you what percentage of page loads fall into "good," "needs improvement," and "poor" ranges for each metric. If you don't see any CrUX data, your site may have too little organic search traffic; in that case, synthetic monitoring tools can provide similar insights while you build traffic.
Building a Performance Benchmark From Competitor Data
Check where your site stands relative to top-ranking competitors. Pull three to five top-ranking URLs for your main keywords, run them through a free Core Web Vitals checker, and compare. WordPress sites achieved 50% good CWV on desktop and 46% on mobile in a November 2025 analysis across 3+ million origins, so if you're a WordPress site, assume your competitors are hitting those benchmarks. To rank above them, target 60%+ on mobile. Here's how the thresholds break down:
| Core Web Vital | Good Threshold | % of Mobile Pages Meeting Standard | Primary Optimization Path |
|---|---|---|---|
| Largest Contentful Paint (LCP) | < 2.5 seconds | 62% | Image optimization, server response |
| Interaction to Next Paint (INP) | < 200 milliseconds | ~70% | JavaScript management, task breakdown |
| Cumulative Layout Shift (CLS) | < 0.1 | ~75% | Reserved space, font-display swap |
Optimizing Largest Contentful Paint (LCP) for Mobile and Desktop

LCP is the hardest metric to pass in practice: only 62% of mobile pages achieve good LCP scores. This metric measures when the largest visual element (usually a hero image, product photo, or text block) becomes visible and interactive. To improve LCP, focus on three levers: server response time, image optimization, and content prioritization.
Reducing Server Response Time and Improving Time to First Byte (TTFB)
The foundation of fast LCP is a fast server. Google calls this "Time to First Byte" (TTFB)—how long it takes for your server to send the first byte of the HTML response. If your server is slow, everything downstream is slow. Improve TTFB by upgrading your hosting provider, enabling caching (Redis, Memcached), and moving to a content delivery network (CDN) so users download from a server close to them, not from your origin server across the country.
For SaaS and content teams managing multiple pages, SEO automation platforms that monitor technical performance can flag when TTFB degrades, so you catch slowdowns before they harm rankings. Many teams publish content but never monitor whether hosting changes or traffic spikes are degrading baseline speed.
Optimizing Images and Loading Critical Content First
Images are almost always the largest element on the page. Optimize by using modern formats like WebP (25–35% smaller than JPEG), lazy-loading below-the-fold images with the loading="lazy" attribute, and serving appropriately sized images to mobile devices. Don't serve a 3000px wide image to a phone. Use responsive images or a dynamic image service that crops and resizes based on screen size.
For LCP images specifically, preload them with <link rel="preload"> and avoid lazy-loading. The fastest LCP improvement comes from optimizing the single largest image on the page. If your hero image drops from 800KB to 120KB (via WebP + resizing), LCP often improves by 0.5–1.5 seconds—a substantial ranking-moving improvement.
Reducing Interaction to Next Paint (INP) Through JavaScript Management
INP replaced First Input Delay (FID) in 2024 because FID only measured the first interaction, while INP measures latency for all user interactions throughout the page session. This shift made JavaScript responsiveness more critical. A page with one fast interaction but slow JavaScript responses on subsequent clicks will fail INP.
Breaking Up Long JavaScript Tasks and Reducing Main Thread Work
Long tasks are the primary cause of slow INP. A long task is any JavaScript execution lasting 50+ milliseconds, which blocks the browser from responding to user input. To pass INP, keep all tasks under 50 milliseconds.
Identify long tasks by running Lighthouse in DevTools and reviewing the "Performance" report. Common culprits are bundled JavaScript that runs on every page load, event handlers that perform heavy DOM manipulation, large third-party scripts (analytics, ads, chat widgets), and complex CSS selectors that force re-layouts.
"Break up long tasks by using setTimeout(..., 0) to defer non-critical work, or use requestIdleCallback() to queue tasks during idle browser time. For marketers without engineering resources, consider a different approach: audit and eliminate non-essential third-party scripts—each tracking pixel, chat widget, or ad network request runs JavaScript that blocks user interactions."
Break up long tasks by using setTimeout(..., 0) to defer non-critical work, or use requestIdleCallback() to queue tasks during idle browser time. For marketers without engineering resources, consider a different approach: audit and eliminate non-essential third-party scripts. Each tracking pixel, chat widget, or ad network request runs JavaScript that blocks user interactions. Removing unused scripts often provides faster INP gains than code optimization alone.
Prioritizing JavaScript and Deferring Non-Critical Code
Web Workers allow you to run JavaScript off the main thread, so heavy computations don't block user interactions. If your site performs real-time calculations, analytics, or data processing, offload that to a Worker. Use <script defer> instead of inline <script> tags, and use dynamic imports to load non-critical modules only when needed. This approach prevents JavaScript from becoming a bottleneck for user interactions.
Controlling Cumulative Layout Shift (CLS) via Reserved Space
CLS is the easiest Core Web Vital to control because it's primarily a content-strategy and CSS problem, not a server or JavaScript problem. Layout shifts happen when content loads asynchronously—an image or ad loads after the page renders, pushing other content down unexpectedly. Reserve space for elements that load dynamically to prevent shifts.
Reserving Space for Images, Ads, and Late-Loading Content
The fix is straightforward: define explicit width and height attributes on images so the browser reserves space before the image downloads. For ads and embeds, use a fixed-height container so ad networks can't load an ad taller than expected. Always include width and height attributes on images, or use aspect-ratio: 16/9 in CSS. Wrap ad code in containers with fixed heights, and use font-display: swap on custom fonts so text renders immediately in fallback font, then swaps to the custom font without jumping layout.
Most sites that fail CLS do so because late-loading fonts, ads, or images cause shifts. This is one of the highest-ROI optimizations: invest 4–8 hours in adding dimensions to key elements, and CLS often drops from 0.15 to below 0.1 in a single iteration.
Avoiding Unexpected Layout Shifts During User Interactions
CLS can also spike when users interact with the page. If clicking a button triggers a dropdown that pushes content down, or if a notification banner appears without reserved space, CLS increases. Test this by reviewing Google Search Console CLS data filtered by interaction type. If CLS spikes at specific points in the user session, the issue is likely interactive elements. Fix by adding position: absolute to modals or dropdowns so they overlay without shifting the layout underneath.
Building Continuous Performance Monitoring Into Your Workflow
Optimizing Core Web Vitals is not a one-time project; it's a continuous operational discipline. As you publish new pages, update old content, and deploy code changes, performance regressions are inevitable. Automating content optimization can reduce optimization time by up to 80%, and when combined with performance monitoring, prevents regressions from lingering undetected.
Setting Up Alerts and Synthetic Monitoring
Set up automated alerts that notify you when CrUX data shows a metric declining below the "good" threshold, Lighthouse synthetic tests exceed target values, a new page publishes with poor Core Web Vitals scores before going live, or third-party scripts degrade performance. Use tools like Hostingstep for continuous monitoring, or build alerts in Google Search Console. The goal is to catch issues in days, not weeks.
Optimizing Content Publishing for Performance-by-Default
For teams publishing high volumes of content, the most effective lever is optimization-by-default at publishing time. Rather than publish a page and optimize later, build performance checks into your workflow. Run every page through automated image optimization, minification, and structure validation before it goes live. AI content strategy systems that include performance validation in the publish step prevent launching pages that meet content quality standards but fail Core Web Vitals thresholds.
Conclusion
Core Web Vitals are a confirmed ranking factor, and the data shows they matter most in competitive categories where content quality is otherwise similar. Only 47% of websites pass the assessment today, meaning the median site is at a disadvantage. The three metrics—LCP, INP, and CLS—measure different dimensions of user experience, and each requires a distinct optimization approach.
The highest-ROI actions are: optimize images aggressively for LCP, audit and remove non-essential JavaScript for INP, and reserve space for dynamic content to control CLS. Most sites can achieve "good" status on 75% of page loads within 4–12 weeks of focused effort. The compound effect is measurable: ranking improvements, lower bounce rates, higher conversion rates, and defensibility against algorithmic volatility.
Start by auditing your CrUX data in Google Search Console. Identify which metric is holding you back (LCP is usually the culprit), and tackle that first. Build performance monitoring into your content publishing workflow so you don't backslide as you grow. Start your SEO agent today and ensure every page you publish meets Core Web Vitals thresholds from day one.
FAQs
What is a good Core Web Vitals score for SEO rankings?
To pass Google's Core Web Vitals assessment and maximize ranking eligibility, 75% of your page's real-user loads need to achieve "good" status across all three metrics. This means LCP below 2.5 seconds, INP below 200 milliseconds, and CLS below 0.1. The data comes from Chrome User Experience Report (CrUX), which tracks real users. Many sites aim for higher—80–90% good across all three—for a competitive edge in dense keyword categories. You can check your CrUX data in Google Search Console under the Core Web Vitals report.
How much does site speed actually affect SEO rankings?
Site speed acts as a tie-breaker in competitive niches. When two pages address the same search query with equally relevant content and similar authority, Google favors the faster page. This effect is strongest on mobile. However, if your content is significantly more relevant or authoritative than competitors, a slower page can still rank. The secondary impact—on conversion rates and bounce rates—is often larger than the ranking impact itself. A 100-millisecond delay reduces conversion rates by 7%, which compounds across thousands of visitors.
What is the easiest Core Web Vital to improve quickly?
Cumulative Layout Shift (CLS) is the easiest metric to improve because it requires no server or JavaScript optimization. Most CLS problems come from missing width and height attributes on images and ads. Add explicit dimensions to images, use fixed-height containers for ads, and apply font-display swap to custom fonts, and CLS often improves from 0.15 to below 0.1 in a single iteration. Most teams can achieve this in 4–8 hours of CSS and markup updates.