Site Speed Optimization for Better Rankings
A 10-second page load time increases mobile bounce probability by 123% compared to a 1-second load. Yet only 42% of mobile sites pass all three Core Web Vitals, and slow domains rank 3.7 percentage points lower in search visibility than fast competitors. Site speed isn't just a conversion lever anymore — it's a ranking prerequisite. Google's 2026 core updates have made INP (Interaction to Next Paint) a primary signal alongside LCP and CLS, meaning every millisecond of performance delay costs you positions. The fix isn't complex, but it requires a systematic approach to identify bottlenecks, implement the right optimizations, and measure progress against real user thresholds.
Key Takeaways
- Pages passing Core Web Vitals (LCP < 2.5s, INP < 200ms, CLS < 0.1) rank visibly higher than failing sites, with fast domains averaging 3.7 percentage points better search visibility (2026, SearchLab)
- Every 1-second delay reduces conversions by 7%, and pages with poor INP (above 200ms) see ranking drops of 0.8 to 4 positions on competitive keywords
- Target competitive benchmarks: LCP under 2.0s, INP under 150ms, TTFB around 180ms for top-3 rankings
- Measure Your Baseline with Core Web Vitals: LCP, INP, and CLS determine search performance; focus on mobile first since only 42% of mobile sites pass all three metrics.
- Optimize Image Delivery and Compression: Modern formats (WebP, AVIF) and lazy loading reduce payload size and improve LCP by up to 30-40%.
- Minimize Render-Blocking Resources: Defer non-critical JavaScript and async CSS to speed up First Contentful Paint and improve interactivity signals.
- Improve Server Response Time with a CDN: Median TTFB for top-3 ranking pages is 180ms; slower sites at positions 7-10 average 420ms TTFB.
- Implement Lazy Loading and Code Minification: Reduce parser cost and initial payload by minifying HTML, CSS, and JavaScript.
Why Site Speed Is a Core Ranking Signal in 2026
Site speed has graduated from a secondary ranking consideration to a gating factor for organic visibility. Only 57.8% of websites pass Google's LCP threshold, and this performance gap directly maps to search position drops. Google's March 2026 core update formalized INP as a primary ranking signal alongside LCP and CLS, cementing speed as non-negotiable for competitive keywords.
"The mechanism is two-fold: slow sites damage crawl efficiency and delay indexation, while slow load times trigger user behavioral signals that Google measures directly — bounce rate, time on page, and pages per session. When a site takes 3+ seconds to load, users leave before engaging, registering as low relevance in ranking algorithms."
The mechanism is two-fold. First, slow sites damage crawl efficiency — your content takes longer for Google's bots to process, delaying indexation and updates. Second, and more impactful, slow load times trigger user behavioral signals that Google measures: bounce rate, time on page, pages per session. When a site takes 3+ seconds to load, users leave before engaging with your content. That abandonment registers as low relevance in Google's ranking algorithms.
The conversion math amplifies the stakes. Every 1-second delay reduces conversions by 7%, meaning a site that loads in 4 seconds instead of 2 loses roughly 14% of revenue per visitor. For organic traffic driving revenue, speed optimization is directly tied to ROI.
Core Web Vitals as the Performance Gatekeeper
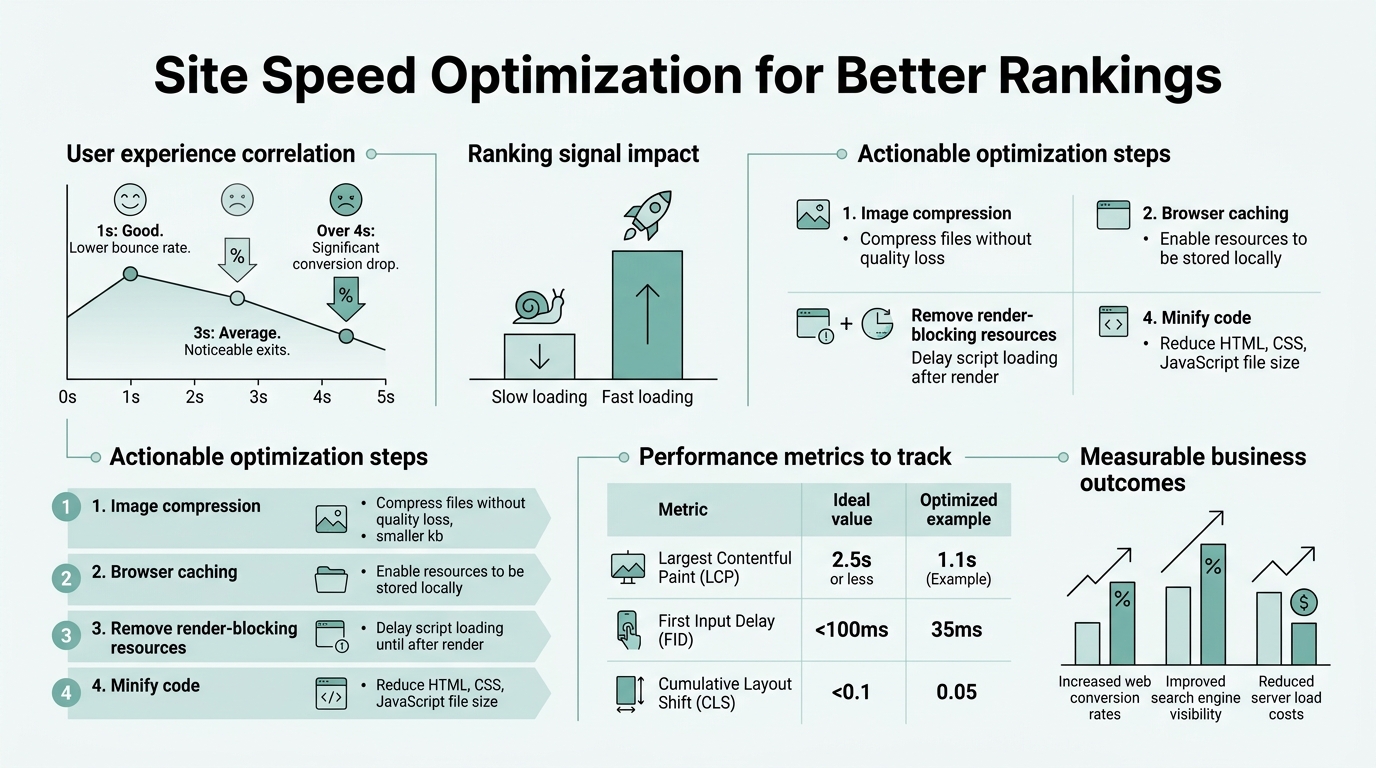
Core Web Vitals are the three metrics Google uses to evaluate user experience: Largest Contentful Paint (LCP), Interaction to Next Paint (INP), and Cumulative Layout Shift (CLS). Each has a specific threshold for "good" performance, and sites must pass all three to avoid search visibility penalties.
- LCP (Largest Contentful Paint): Measures when the main content on a page becomes visible to users. Target: under 2.5 seconds (good), ideally under 2.0 seconds for competitive rankings.
- INP (Interaction to Next Paint): Captures the delay users experience when they click, tap, or interact with a page element. Target: under 200ms (good), with 150ms or better increasingly required for top-3 positions.
- CLS (Cumulative Layout Shift): Measures visual instability as elements move around the page. Target: under 0.1 (good), which translates to minimal unexpected layout changes during load.
The competitive threshold is tightening. Sites ranking in positions 1–3 have median TTFB of 180ms and LCP under 2.0 seconds, while positions 7–10 average TTFB of 420ms and weaker LCP. Pages with 75%+ of page loads achieving "Good" LCP scores receive 23% more organic traffic than comparable sites with poor LCP. This isn't correlation — it's ranking weight.
INP: The 2026 Game-Changer
INP replaced First Input Delay (FID) in 2024 and emerged as the most rapidly evolving ranking signal. The shift matters because INP captures real-world interaction delays that directly affect user experience. A site might load fast (good LCP) but become unresponsive on user interaction — that's INP failure, and it now costs positions.
"Pages with INP above 200ms face ranking penalties of 0.8 to 4 positions on competitive queries, with steepest drops above 500ms. Framework and hosting choices are critical: slow JavaScript parsing, main-thread blocking, and layout thrashing all increase INP and directly correlate with ranking loss."
Current benchmarks show pages with INP above 200ms face ranking penalties of 0.8 to 4 positions on competitive queries, with the steepest drops above 500ms. This is why frameworks and hosting choices matter: slow JavaScript parsing, main-thread blocking, and poor layout thrashing all increase INP. Independent audits from Digitalapplied's 2026 performance analysis show that INP improvements correlate directly with ranking recovery on high-volume keywords.
How to Measure Your Current Performance and Identify Bottlenecks
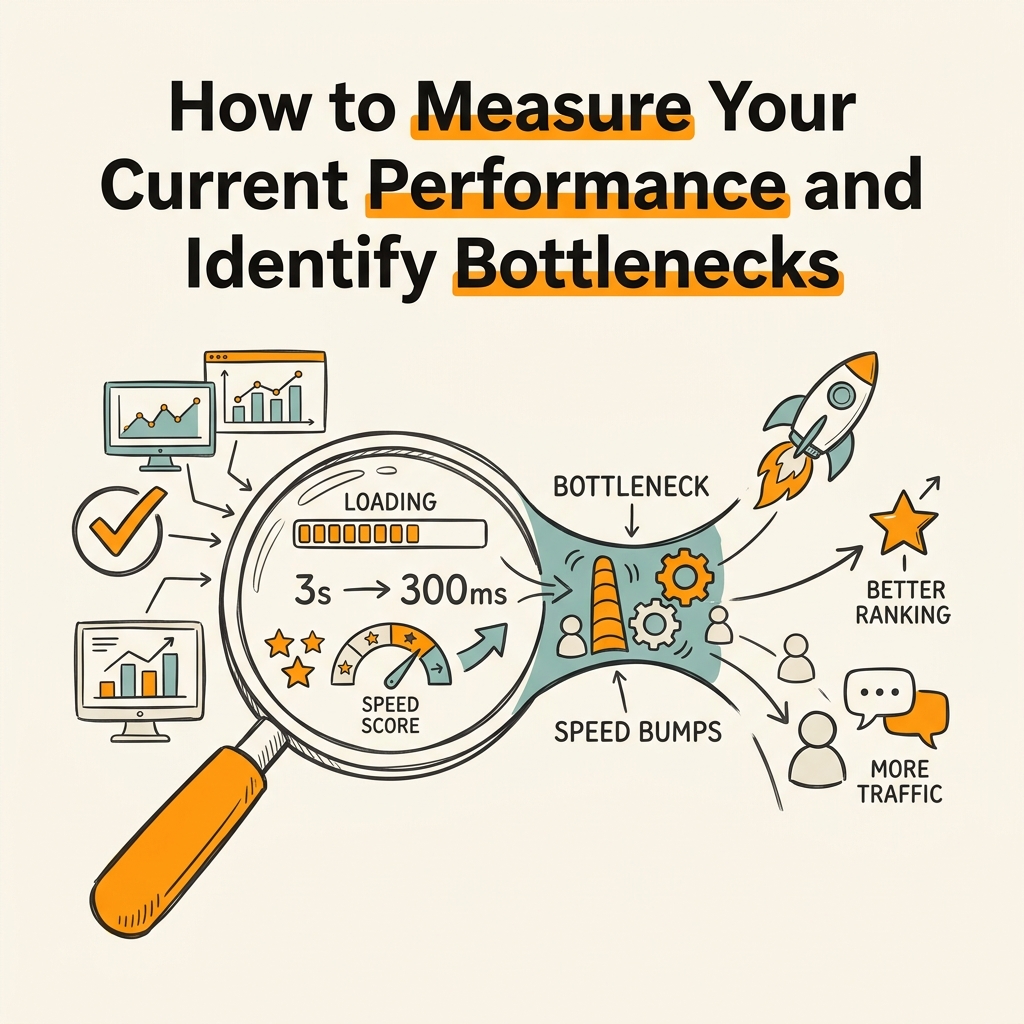
You can't optimize what you don't measure. Start by running your homepage and key landing pages through Google's PageSpeed Insights and Core Web Vitals tools, then move deeper into your site's real user data via Google Search Console and Google Analytics 4. The goal is distinguishing lab data (synthetic tests) from field data (real user performance), as outlined in Ppcinfo's Core Web Vitals analysis for 2026.
Running Your Baseline Audit with Google Tools
Google PageSpeed Insights combines lab scores (Lighthouse) with real-world field data from the Chrome User Experience Report. This dual view is critical: a lab test might show fast performance, but real users on mobile might experience very different load times. Focus on the field data first — it reflects your actual ranking risk.
Google Search Console's Core Web Vitals report segments your site into three categories: good, needs improvement, and poor. Pages in the "poor" bucket are your priority. Export this data weekly to track whether optimizations move pages up. Pair this with Google Analytics 4 segments comparing traffic and bounce rate between fast and slow pages — you'll see the conversion impact viscerally.
For deeper technical diagnostics, use Chrome DevTools' Network tab to profile asset loading, Lighthouse (built into DevTools) to test under simulated 4G connections, and Coverage tab to identify unused CSS and JavaScript.
Field Data vs. Lab Data: Why Both Matter
Lab scores (Lighthouse tests) run on a fixed, controlled machine. They're reproducible and isolate specific issues. But field data reflects real browsers, network conditions, devices, and user hardware. A page might score 95 on Lighthouse desktop but fail Core Web Vitals in the field on slow 3G mobile networks.
Real user monitoring (RUM) via tools like Segment or Vercel's Web Analytics captures INP, LCP, and CLS from live traffic. This is what Google actually measures for rankings. If field data shows poor performance, lab data debugging tells you why.
Optimize Image Delivery and Asset Compression
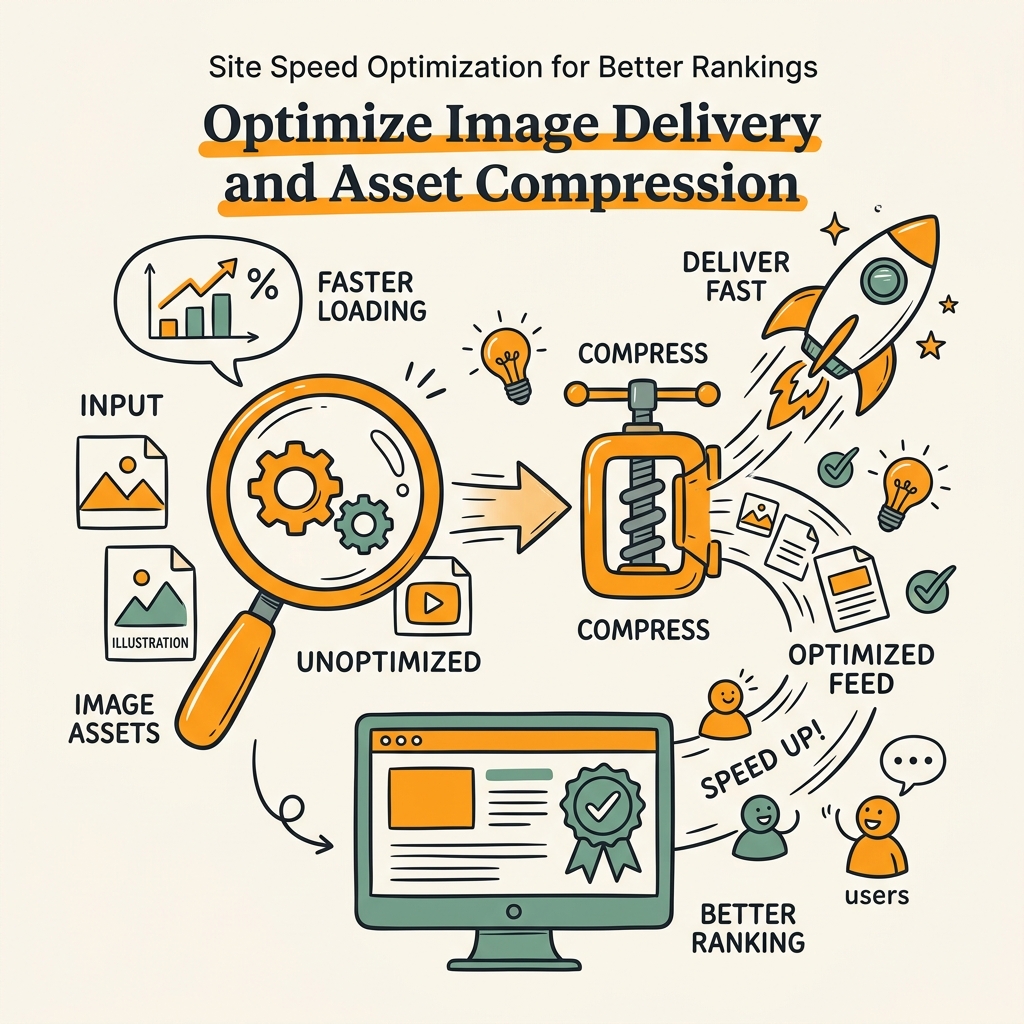
Images typically consume 50-80% of page payload on modern sites, making image optimization the single highest-impact speed win. Modern formats and delivery strategies can reduce image size by 40-60% without quality loss, directly improving LCP and overall page load time. This is foundational work that compounds across your entire site. Learn more about compression techniques from Searchlab's SEO impact of website speed research.
Adopt Modern Image Formats and Lazy Loading
WebP and AVIF formats reduce file size by 25-35% compared to JPEG for visually identical images. Implement these with fallbacks: serve WebP to supporting browsers, AVIF for cutting-edge browsers, and JPEG for older devices. Pair this with lazy loading — only load images as users scroll them into view, deferring off-screen images until needed.
The HTML attribute loading="lazy" is natively supported in modern browsers and requires zero JavaScript. Combined with responsive image sizes using srcset, this approach ensures users on mobile never download desktop-resolution images, saving kilobytes per image.
For background images and decorative elements, use CSS with CSS Grid or Flexbox instead of image elements. This eliminates payload entirely and speeds rendering. Reserve image elements for content that needs high fidelity.
Server-Side Image Optimization with CDNs
Content Delivery Networks (CDNs) with built-in image optimization — like Cloudflare, Fastly, or AWS CloudFront — automatically convert, compress, and resize images on-the-fly based on device type, network speed, and browser support. You upload one high-quality image; the CDN handles format negotiation and responsive delivery.
This approach eliminates the need to manually generate ten versions of each image. It also enables loading="lazy" to skip true off-page images entirely, since the CDN only serves what's needed. Sites using CDN-powered image optimization report LCP improvements of 30-40% with minimal development effort.
Combine CDN image delivery with GZIP and Brotli compression on your HTML, CSS, and JavaScript. Brotli is newer and compresses 10-15% more efficiently than GZIP on text assets. Enable it on your hosting provider or reverse proxy.
Reduce Render-Blocking Resources and Optimize JavaScript
JavaScript is the primary culprit in slow interactivity (high INP). Most sites ship 200-500 KB of JavaScript, much of which blocks the main thread and delays user interactions. The fix involves deferring non-critical JavaScript, breaking up long tasks, and using modern code-splitting patterns.
Defer and Async JavaScript Execution
By default, script tags block HTML parsing. When the browser encounters a <script src="app.js"></script> tag, it pauses parsing, downloads and executes the script, then resumes. This delays FCP and LCP.
Use async and defer attributes to change this behavior:
- async: Downloads in parallel but executes immediately once ready, potentially out of order. Use for independent scripts like analytics or third-party widgets.
- defer: Downloads in parallel but executes after HTML parsing completes, in document order. Use for critical application code that needs the DOM.
Move render-blocking CSS to below-the-fold usage. Critical CSS (styles needed for above-the-fold rendering) can be inlined in a <style> tag in the HTML head; non-critical CSS loads asynchronously with rel="preload" and onload="this.rel='stylesheet'". This ensures users see paint quickly without waiting for all styles.
Break Up Long JavaScript Tasks and Use Code Splitting
The main thread (which executes JavaScript) has a 50ms budget per frame at 60 FPS. Any single task over 50ms blocks the next interaction for 50ms+, degrading INP. Modern frameworks (React, Vue, Next.js) support code splitting — bundling only the JavaScript needed for the current page, deferring the rest until needed.
For content-heavy sites, automating performance checks through content marketing automation solutions helps identify which scripts are truly critical for each page. By automating content optimization and audits, modern platforms integrate performance insights into publishing workflows, flagging pages at risk of speed penalties before they rank.
Use requestIdleCallback() for non-critical work that can run when the browser is idle. Analytics events, non-essential DOM updates, and prefetching can all defer until after user interactions complete, improving INP.
Improve Server Response Time and Leverage a CDN
Time to First Byte (TTFB) is the delay before the server responds to a request. Ranking pages average 180ms TTFB; pages in positions 7–10 average 420ms. TTFB is determined by server processing power, database queries, and network latency to the user. CDNs and server optimization are the primary tools.
Optimize Server-Side Code and Caching
Profile your server using APM tools like New Relic or Datadog to identify slow database queries, inefficient API calls, and parsing bottlenecks. Common culprits include:
- Unoptimized database queries: N+1 problems, missing indexes, or queries that fetch too much data.
- Third-party API calls on the critical path: Move external API requests to background jobs or cache their results.
- Inefficient template rendering: Cache rendered HTML fragments instead of regenerating on every request.
Enable HTTP caching headers (Cache-Control, ETag) so browsers and CDNs cache responses. Set a TTL (time-to-live) appropriate to your content; static assets can cache for months, HTML for minutes to hours. This prevents unnecessary server hits and dramatically improves TTFB for repeat visitors.
Use a Global CDN to Reduce Latency
CDNs like Cloudflare, AWS CloudFront, and Fastly distribute your content across geographically dispersed servers. A user in Tokyo doesn't request from your US server — they request from a CDN edge server in Japan, reducing latency by 100-300ms. This cuts TTFB nearly in half for international traffic.
Beyond caching static assets, modern CDNs offer:
- Intelligent caching rules: Cache HTML with purge-on-update, reducing origin requests.
- Edge computing: Run lightweight code at the CDN edge to redirect, filter, or transform requests before hitting your origin.
- DDoS and bot protection: Free performance wins by blocking bad traffic before it reaches your origin.
For SaaS and content-heavy sites, a CDN is non-negotiable. The cost ($20-200/month) pays back within days through reduced server load and improved rankings.
Monitoring, Continuous Improvement, and Automation
Speed optimization isn't a one-time project — it's a continuous discipline. After your initial optimizations, establish monitoring and automated workflows to catch regressions before they impact rankings. Many teams fail here, letting performance degrade as they add features and content without tracking it.
Set Up Real User Monitoring and Alerting
Install a RUM solution like Vercel Web Analytics, Google Analytics 4's Web Vitals report, or a dedicated tool like Datadog RUM. Configure alerts for Core Web Vitals threshold breaches: if LCP jumps above 3 seconds or INP exceeds 300ms, you get notified immediately, not after Google's ranking algorithms penalize you.
Segment monitoring by URL, device type, and network connection. You might find that mobile 3G users have poor performance while desktop users see good metrics. This segmentation guides where to focus optimization effort.
Automate Performance Testing in Your CI/CD Pipeline
Run Lighthouse tests on every code deployment and fail the build if performance regresses. Tools like lighthouse-ci integrate into GitHub Actions, GitLab CI, or your preferred platform. This prevents developers from unintentionally shipping JavaScript-heavy components or unoptimized images.
For content-driven sites, performance testing should extend to new article pages. Platforms that automate SEO content planning and publication can help prevent the common scenario where marketing teams add high-resolution unoptimized images, tanking performance before launch.
| Optimization Tactic | Typical Speed Gain | Effort Level | Priority |
|---|---|---|---|
| Image optimization (WebP + lazy loading) | 20-40% LCP improvement | Low | Critical |
| Defer non-critical JavaScript | 30-50% FCP/INP improvement | Medium | Critical |
| Implement CDN for static assets | 30-60% TTFB reduction | Low | Critical |
| Enable GZIP/Brotli compression | 15-25% payload reduction | Low | High |
| Minify HTML, CSS, JavaScript | 10-20% parser overhead reduction | Low | High |
| Upgrade hosting / server resources | 20-30% server processing reduction | Medium | Medium |
| Implement HTTP caching headers | 50-80% repeat visitor TTFB reduction | Low | High |
Conclusion
Site speed is no longer a technical nice-to-have — it's a ranking prerequisite. With only 42% of mobile sites passing all three Core Web Vitals, and fast domains ranking 3.7 percentage points higher in search visibility, optimizing your site's performance is directly optimizing your organic traffic and revenue.
The path forward is systematic: measure your baseline with Google tools, optimize images and JavaScript, improve server response time with a CDN, and set up continuous monitoring to catch regressions. These tactics compound — a site that improves LCP by 1 second, reduces INP to under 150ms, and enables lazy loading will see measurable ranking lifts within 4-8 weeks.
For teams scaling content production, automating performance checks is as important as optimizing infrastructure. Start your SEO agent to ensure every piece of content you publish meets Core Web Vitals standards before it ranks.
FAQs
How much does site speed impact SEO rankings?
Site speed is now a primary ranking signal in Google's algorithm. Pages with poor Core Web Vitals see ranking drops of 0.8 to 4 positions on competitive keywords, and fast domains rank 3.7 percentage points higher in search visibility overall. Additionally, every 1-second delay reduces conversions by 7%, so speed optimization directly impacts both organic traffic volume and revenue per visitor. The impact is largest on mobile searches, where only 42% of sites currently pass all three Core Web Vitals metrics.
What are the most important performance metrics to focus on?
Core Web Vitals — LCP, INP, and CLS — are the metrics Google uses to evaluate ranking eligibility. Largest Contentful Paint (LCP) should be under 2.5 seconds, ideally under 2.0 seconds for top-3 rankings. Interaction to Next Paint (INP) must be under 200ms, with 150ms or better required for competitive visibility. Cumulative Layout Shift (CLS) should be under 0.1 to ensure visual stability. Beyond these three, Time to First Byte (TTFB) correlates strongly with rankings: median TTFB for positions 1–3 is 180ms, while positions 7–10 average 420ms.
What's the fastest way to improve site speed for rankings?
Image optimization (converting to WebP/AVIF and enabling lazy loading) delivers 20-40% LCP improvements with minimal effort, followed by deferring non-critical JavaScript to improve INP. Both changes can be implemented in days and have immediate ranking impact. For broader improvements, enabling a CDN reduces TTFB by 30-60% and is a simple one-time setup. These three tactics combined typically move the majority of Core Web Vitals into the "good" range within 2-4 weeks, with rankings following as Google recrawls and re-evaluates your site.