Traffic Attribution: Which Content Drives Revenue
Most founders and marketing teams assume their highest-traffic content is their most valuable. It's an intuitive guess—but it's wrong. Without proper attribution, you're likely missing 23% of the revenue your content actually generates. Traditional last-click models credit only the final touchpoint before conversion, leaving early-stage educational content invisible. The buyer's journey isn't linear anymore. Today's decision-makers interact with 27+ touchpoints before closing, and nearly 38% of your B2B pipeline stays completely hidden without multi-touch attribution. The fix? Moving beyond surface metrics to understand which content pieces genuinely drive revenue across the full customer journey. Here's how to measure content impact correctly and optimize your strategy accordingly.
Key Takeaways
- Multi-touch attribution reveals 23% more revenue influence from content compared to last-click models (Genesys Growth, 2026)
- Organizations using proper attribution see 15–30% higher marketing ROI and 27% lower customer acquisition costs (McKinsey, 2026)
- 38% of B2B pipeline remains unattributed without multi-touch tracking, making content's true value invisible
Quick Scan: What You'll Learn
- Understanding Attribution Models: Last-click only captures the final interaction, while multi-touch reveals which content pieces influence decisions across the entire journey.
- The Content Attribution Gap: Content marketing delivers 3x ROI but traditional models severely undervalue early-stage awareness pieces.
- Building Your Attribution Foundation: Unified data infrastructure connecting CRM, analytics, and ad platforms is the prerequisite for accurate measurement.
- Optimizing Content Based on Attribution Data: Use revenue attribution insights to reallocate budget toward high-impact content at each journey stage.
- Automation at Scale: Modern tools now streamline content creation, distribution, and attribution tracking without manual overhead.
What Is Traffic Attribution and Why Does It Matter?
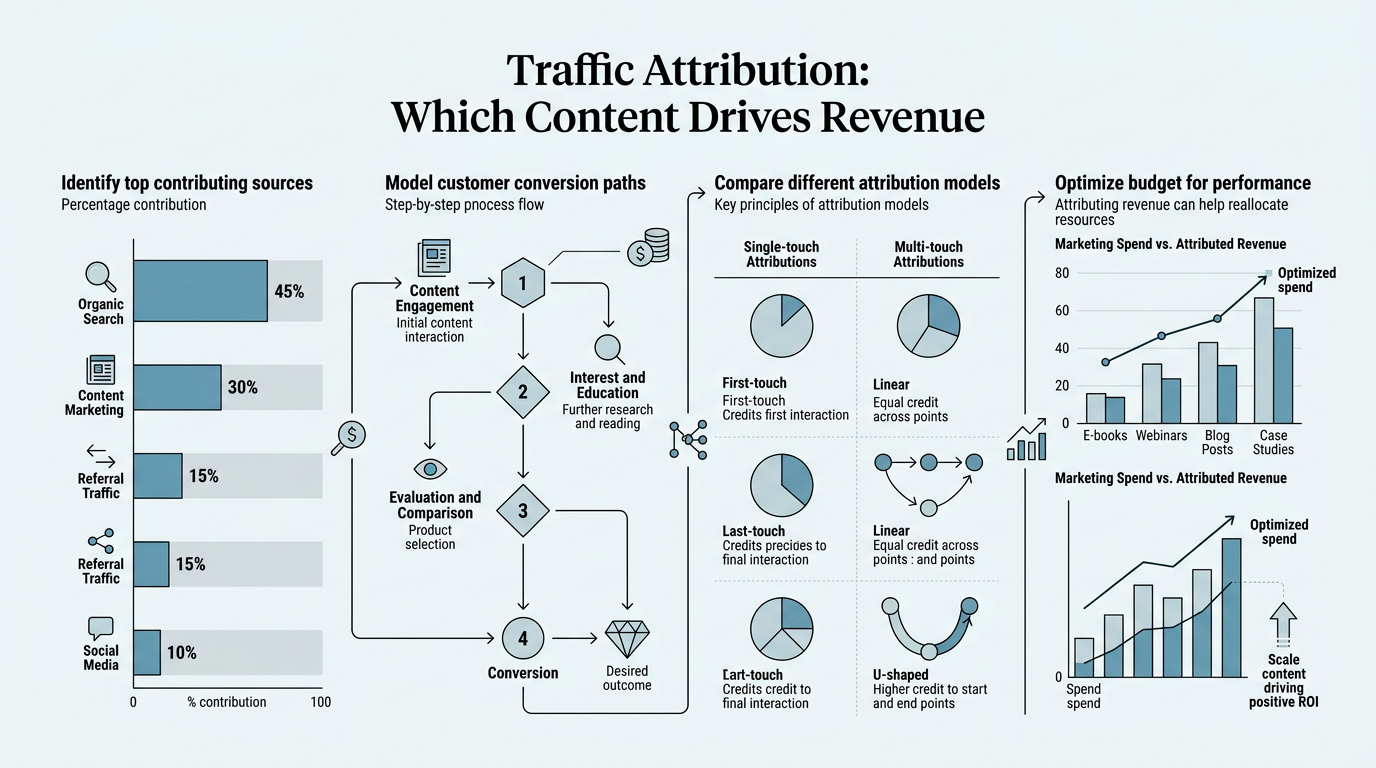
Traffic attribution answers a deceptively simple question: which content actually drove the revenue? But the answer is far more complex than traffic volume. Attribution is the process of assigning credit to specific content touchpoints along the customer journey—recognizing that conversions rarely happen after a single interaction. Buyers now average 27 distinct touchpoints before making a purchase decision, meaning one blog post or guide might be the initial spark while another closes the deal. Without attribution, marketers optimize for the wrong metrics, typically focusing on direct conversions and last-click traffic while starving early-stage awareness content of resources.
This blindness costs real money. Organizations that implement proper multi-touch attribution achieve 1.7x faster revenue growth compared to those relying on last-click models alone. The reason? They finally understand which content stages influence decisions. Awareness-stage blog posts might not drive clicks, but they establish authority and move prospects into consideration. Case studies and comparison guides appear later in the journey but convert at higher rates. Educational webinars capture leads. Without attribution, you can't see these patterns.
"Multi-touch attribution isn't just about measuring better—it's about seeing the invisible. The content your best customers discovered first is likely the content your finance team wants to cut because it doesn't show up in last-click reports. That's where the real ROI hides."
The Last-Click Attribution Problem
Last-click attribution is simple: the piece of content or channel closest to the conversion gets 100% credit. On the surface, this feels fair—the prospect just watched your product demo video, then signed up. The video gets the win. But this model ignores everything that happened before. The prospect might have discovered your brand through a blog post weeks earlier, read three comparison guides, downloaded a whitepaper, and attended a webinar. Last-click erases all of that context and pretends the demo was the only thing that mattered.
The impact is severe. Last-click attribution systematically undervalues content that educates early-stage buyers. Studies show multi-touch models reveal 23% more revenue influence from content compared to last-click—meaning you're throwing away nearly a quarter of content's proven impact if you're using single-touch measurement. Most marketing teams don't realize this gap exists until they switch models and suddenly see the true picture.
How Multi-Touch Attribution Works
Multi-touch attribution spreads credit across multiple touchpoints. A buyer's conversion journey might be structured like this: blog post (10% credit), comparison guide (15% credit), webinar (20% credit), product page (25% credit), demo (30% credit). Different models distribute credit differently. Position-based models weight first and last touches heavily. Linear models divide credit evenly. Data-driven (algorithmic) models use historical conversion data to assign credit based on actual impact. For busy founders evaluating which approach to adopt, data-driven models deliver the highest accuracy and ROI improvement, showing 43% gains in marketing ROI at top-performing companies.
The magic happens when you layer this data into your CRM and analytics stack. Suddenly you can answer questions your business actually cares about: Which content pieces drive deals in our enterprise segment? Which pages accelerate deal cycles? Which pieces consistently appear before conversion in our sales data? This visibility is impossible with last-click.
How to Measure Which Content Drives Revenue
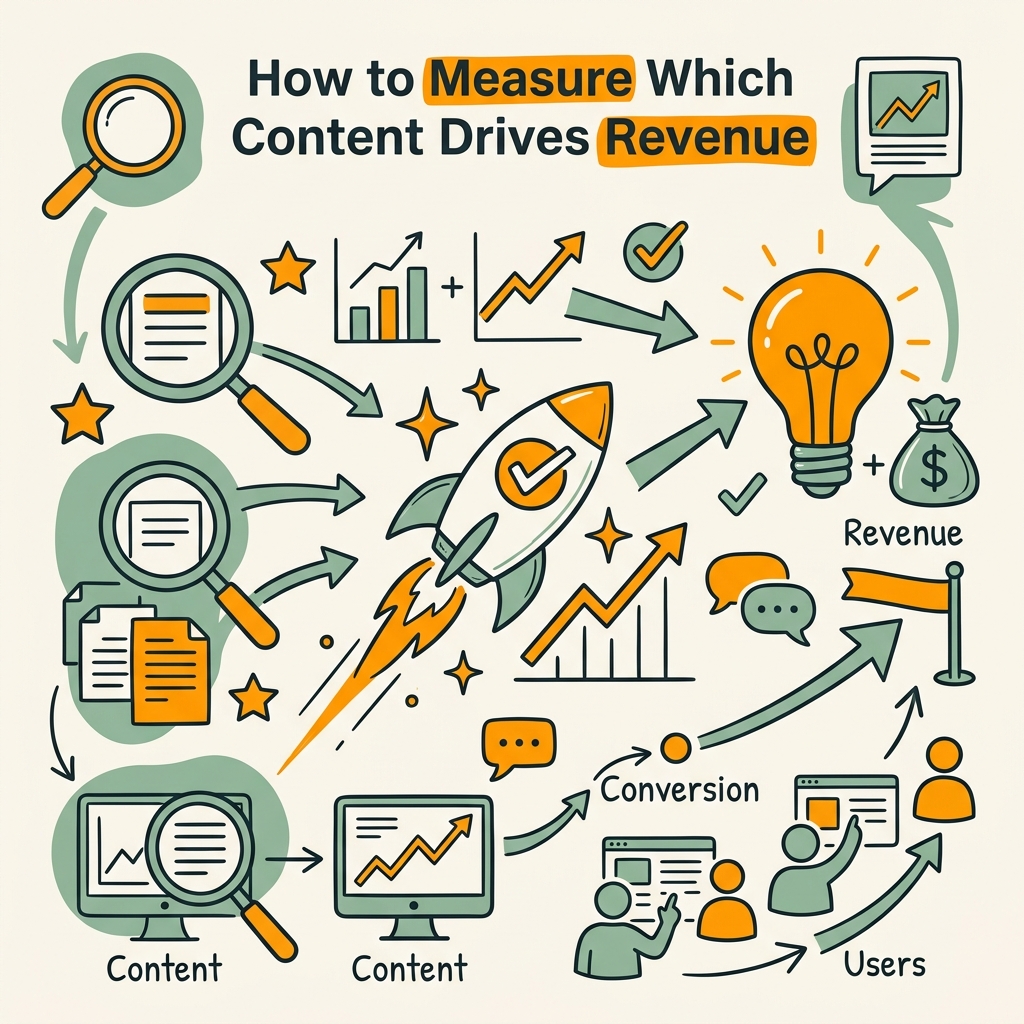
Measuring content's revenue impact requires three components: unified data, a clear attribution model, and a system to track touchpoints. Without all three, your measurement will fail. You need your CRM to talk to your analytics platform, your analytics platform to track ad platforms, and all of this connected to your web tracking. Building this infrastructure is the first real bottleneck—and it's why only 34% of companies currently have sufficient data infrastructure to run effective multi-touch attribution.
Start by auditing your current setup. Can your CRM see every interaction a lead had before becoming a customer? If the answer is no, that's your starting point. You may need to implement a Customer Data Platform (CDP) or build custom data pipelines to unify your sources.
Setting Up Your Data Infrastructure
A functional attribution system requires four data sources working in sync: your CRM (customer records and deal data), your analytics platform (page views and interactions), your ad platforms (ads served and clicks), and your email marketing system (opens and clicks). Each system must timestamp its data and track the same customer ID across platforms. This sounds straightforward but isn't. Most companies have siloed systems where marketing looks at Google Analytics, sales owns Salesforce, and ads live in separate dashboards.
The solution is a unified data warehouse. Companies that build a unified CRM, ad platform API integration, and web analytics connection see a direct correlation to 1.7x faster revenue growth. This infrastructure takes 4-8 weeks to set up properly, but it unlocks everything downstream. Tools like Segment or mParticle can accelerate this. Or your analytics/CDP vendor (Mixpanel, Amplitude) can handle it.
"The companies winning on attribution aren't smarter marketers. They're just willing to do the unglamorous data work first. Four weeks of plumbing pays dividends for years."
Choosing an Attribution Model That Fits Your Sales Cycle
Not all attribution models suit every business. Your choice depends on your sales cycle length, customer complexity, and data maturity. Fast-moving DTC businesses with short sales cycles (3-7 days) can function with position-based or time-decay models. B2B SaaS with 30-90 day cycles needs multi-touch. Enterprise software with 120+ day cycles should use data-driven attribution.
The key principle: your attribution window must match your actual buying cycle. If a buyer takes 60 days from first touch to close, your attribution model must track at least 60 days of interactions—not assume conversions happen after 7. Using a 120-day attribution window instead of a 7-day window often reveals a 120% increase in attributed revenue, according to WARC and Google data. This isn't fabricated value; it's hidden value your short-window model was missing.
| Attribution Model | Best For | Accuracy | ROI Improvement |
|---|---|---|---|
| Last-Click | Baseline comparison only | ~42% | Baseline (0%) |
| Position-Based | Fast sales cycles (<30 days) | ~67% | +5–12% |
| Multi-Touch (Linear) | Mid-length cycles (30–90 days) | ~80% | +15–30% |
| Data-Driven (Algorithmic) | Long, complex cycles (90+ days) | ~85% (highest) | +43% (top quartile) |
Tracking Content Touchpoints in Your Full Journey
Once your data is unified, you need to ensure every content touchpoint is tracked and labeled. A blog post visit without source data is useless. A whitepaper download that isn't connected to a lead ID in your CRM disappears. This requires intentional tagging and UTM discipline. Every link pointing to your content should carry a UTM parameter identifying the content type, topic, and stage. Every page on your site should track engagement depth (scroll depth, time on page, clicks).
Advanced setups use event tracking. Instead of just counting page views, you track: blog post read (2+ min on page), whitepaper downloaded, webinar attended, demo booked. These events fire into your data warehouse, each tied to a customer ID. When that ID later closes in Salesforce, you can trace the full path. Most founders and marketing teams find that B2B buyers have an average of 27 distinct touchpoints in their journey—meaning attribution tracking needs to capture dozens of interaction types, not just the last two clicks.
Which Content Types Actually Drive Revenue?
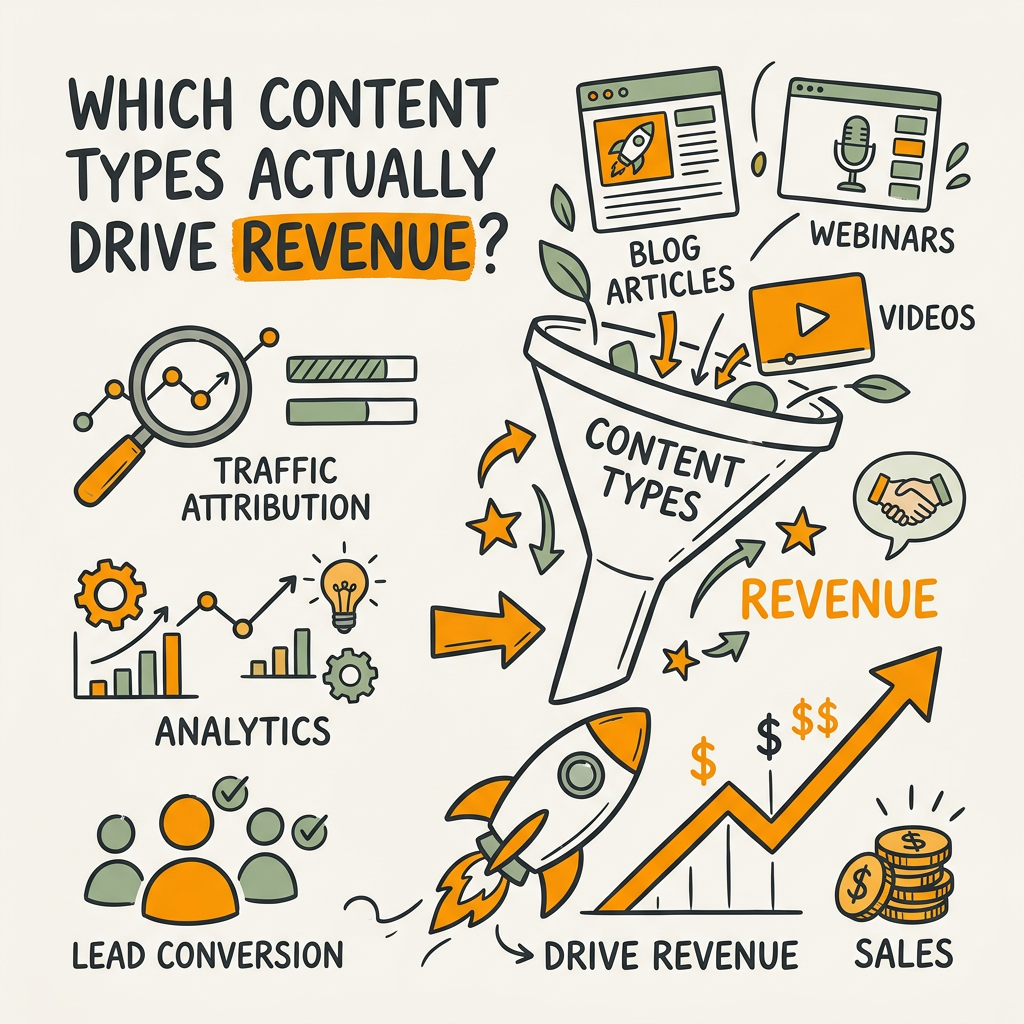
With proper attribution in place, you'll notice patterns. Not all content is equal. Some pieces generate high traffic but few conversions. Others drive fewer visits but convert at significantly higher rates. Some appear early in 90% of winning deals; others close deals but rarely appear first. Attribution reveals these patterns.
Blog Content and Awareness-Stage Revenue Impact
Blog posts are often dismissed as low-intent. A 3,000-word guide on "how to hire a VP of sales" doesn't mention your product. It shouldn't. Awareness-stage content educates without selling. In last-click attribution, blog posts appear invisible or low-value because they rarely trigger immediate conversions. But with proper multi-touch tracking, you see the truth: blog content appears in the first touchpoint of 65-75% of eventual customers, establishing authority and filtering prospects into your funnel.
Blog content that drives the most revenue tends to share three characteristics:
- Targets problems your ICP faces (not generic advice)
- Demonstrates deep expertise that competitors can't match
- Links internally to solution-focused content
A blog post on database scaling challenges that later links to your infrastructure comparison guide creates a natural progression. Blog alone doesn't close deals, but it seeds the journey. Content marketing delivers $3 in returns per $1 spent, making it the highest-ROI channel when measured correctly—but this ROI requires 3-6 months to materialize.
Comparison Guides and Consideration-Stage Conversions
Comparison content appears much later in journeys but converts at dramatically higher rates. A "Shopify vs WooCommerce" guide or "Salesforce vs HubSpot CRM" post attracts buyers actively evaluating solutions. These readers are far closer to purchase than someone reading a foundational guide. Attribution data shows comparison content appears in 40-60% of deals that close within 30 days. It's high-intent content with shorter decision windows.
The catch? Comparison guides only perform well if they're deeply researched and unbiased in presentation. A guide that obviously shills your product loses credibility. The most effective comparison content for B2B buyers acknowledges trade-offs and explains why different companies choose different solutions. This honesty builds trust and actually drives more conversions than one-sided advocacy.
Case Studies, Demos, and Bottom-Funnel Revenue
Case studies and product demos appear at the very bottom of the funnel. These pieces have a single job: convert active prospects into customers. They have the highest conversion rates per impression—often 5-15% depending on segmentation. In attribution models, case studies and demos frequently capture 25-40% of conversion credit because they're closest to the decision point. But they can't work without the upstream content that warmed up the prospect.
This is why focusing only on bottom-funnel content fails. Some founders and teams optimize purely for demo requests and case study downloads, starving awareness and consideration content. Attribution reveals the dependency: remove blog content and comparison guides, and your demo requests drop 40-60% within three months as the funnel top dries up.
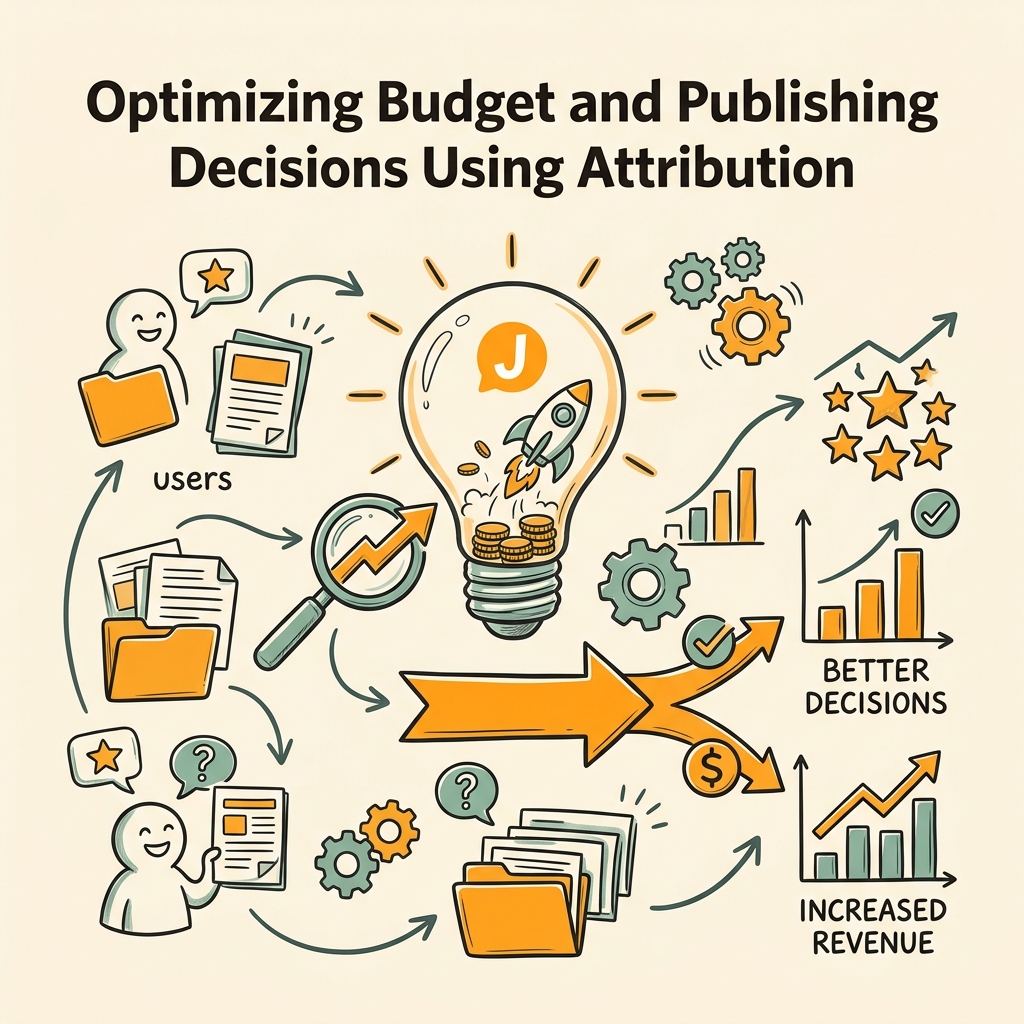
Optimizing Budget and Publishing Decisions Using Attribution
Once you understand which content drives revenue, the optimization question becomes: how do you allocate resources to maximize ROI? Organizations using multi-touch attribution report an average 18-22% budget reallocation across content types and channels. They shift spending from low-impact pieces to high-impact ones. But "high-impact" must be defined correctly.
Identifying Revenue-Driving Content Clusters
Your highest-revenue content rarely lives in isolation. It's usually part of a cluster. A single blog post on "demand generation frameworks" might convert 0.2% of visitors. But when paired with a related post on "ABM setup," a comparison guide, a case study, and an email sequence, conversion rates jump to 8-12%. Attribution reveals these clusters. You see that three pieces always appear together in winning journeys. These clusters become your core content investments.
Busy founders especially benefit from content clustering. Instead of writing 100 random topics, focus on 10-15 tight clusters where each piece links to and reinforces the others. This multiplier effect compounds. One well-built cluster can drive 3-5x more revenue than scattered individual pieces. Tools that automate content research and internal linking can help identify and execute these clusters at scale without requiring manual oversight of every piece.
Reallocating Spend Away from Vanity Metrics
Attribution exposes vanity metrics. A blog post that gets 10,000 visits monthly but converts 0.05% of visitors and never appears in customer journeys is a waste. A technical deep-dive that gets 200 visits monthly but appears in 30% of enterprise deals and converts 12% of visitors is underinvested. Most teams have this reversed. They optimize for traffic and rankings, not revenue.
The reallocation question becomes: should you continue publishing that 10,000-visitor post, or redirect the effort into 10 posts targeting your actual buyer's journey? Attribution data makes this question answerable. You're not guessing anymore. You're following the revenue.
Common ways teams reallocate after implementing attribution:
- Cut low-performing evergreen content that never appears in deals
- Double down on high-impact clusters with 2-3x more publishing frequency
- Shift SEO budget from high-volume, low-conversion keywords to niche, deal-driving keywords
- Invest in customer research and case study production
- Reduce paid amplification for vanity-metric content
Extending Attribution Windows for Long-Cycle Content
A critical mistake: using short attribution windows (7-30 days) for content with long buyer cycles. If your typical sales cycle is 90 days, a prospect who reads a blog post on day 1 and converts on day 87 appears invisible in a 30-day attribution window. The blog post gets zero credit, even though it was the initial trigger. The contract appears to come from nowhere.
Extending your attribution window to match your actual buying cycle fixes this. Most B2B SaaS companies should use 60-90 day windows. Enterprise sales often need 120+ days. Making this shift alone can reveal 50-120% more attributed revenue because you're finally seeing the full journey instead of truncating it.
Tools and Automation for Tracking Content Revenue Attribution
Manual attribution tracking is error-prone and incomplete. As your content library grows, human-powered measurement breaks down. You need automated systems that tag content, track interactions, and connect to your CRM. Several categories of tools handle this: attribution platforms (HockeyStack, Ruler Analytics, MultiTouch), CDPs (Segment, mParticle), and content automation platforms that integrate attribution from the start.
Attribution Platforms: Purpose-Built Tools for Measurement
Dedicated attribution platforms are designed solely for multi-touch measurement. They pull data from your ad platforms, analytics, CRM, and email system, unify it, and apply attribution logic. Tools like HockeyStack or Ruler Analytics are strong if you already have solid data infrastructure. They're visualization and modeling layers on top of your existing data.
The limitation? They're measurement-only. They don't help you create the content or optimize it beyond showing you which pieces matter most. They answer "which content drove revenue" but not "which content should we create next." For founders and lean teams, this creates a gap: you measure attribution but still manually write, optimize, and publish content.
Content Automation With Built-In Attribution
A more integrated approach combines content creation with attribution tracking from the start. When you automate content research, writing, and publishing, you can build attribution and internal linking directly into the output. Each piece is tagged with its stage, cluster, and keywords. Each outbound link is UTM-tagged. Each internal link is intentional. This eliminates the manual tagging burden that derails most attribution projects.
Jottler, for example, automates content generation for busy founders—researching topics, writing 3,000+ word articles, and publishing them directly to your CMS. Because the system handles creation and publishing, it can automatically apply consistent UTM tagging, internal linking, and attribution-friendly metadata. A founder can set their desired publishing frequency (1-5 articles daily) and let the AI agents handle research, writing, fact-checking, and CMS distribution. This is the only way most busy teams can scale content without burning out, and it ensures attribution-friendly structure from day one.
Data Infrastructure: The Real Bottleneck
The biggest challenge with attribution isn't the software. It's the data plumbing. Your CRM, analytics platform, ad accounts, and email system need to be connected with consistent customer IDs and timestamped interactions. This is manual work, and it's error-prone. You might have a sales team entering leads manually into Salesforce while your marketing automation platform creates duplicates. You might have Google Analytics tracking one user ID while Intercom tracks another.
Solving this requires several steps:
- Clean data entry (or API integrations that avoid manual entry)
- Unified customer ID systems across all platforms
- Data engineer time or CDP configuration
- Ongoing data quality monitoring and audits
Budget 4-12 weeks and $5,000-20,000 to get this right. It's the unglamorous foundational work that makes everything else possible. Only 34% of companies have this infrastructure in place, which is why most teams can't implement attribution despite wanting to.
Common Attribution Mistakes and How to Avoid Them
Even with good intentions, most organizations make systematic attribution errors. These mistakes produce misleading data and wrong decisions. Knowing what to avoid is as important as knowing what to do.
Using Attribution Windows That Don't Match Your Sales Cycle
This is the most common mistake. A B2B SaaS company with a 60-day average sales cycle using a 7-day attribution window will systematically undervalue awareness and consideration content. Everything appears to convert immediately from bottom-funnel content. Months later, they'll wonder why removing blog content crushed their pipeline.
Fix: calculate your actual sales cycle length. Pull your last 50 won deals and measure the days from first touch to close. Use that as your attribution window minimum. Err on the side of longer rather than shorter.
Ignoring the "Dark Funnel"—Unattributed Pipeline
Direct traffic, untagged links, and offline conversations hide a huge portion of your actual funnel. 38% of B2B pipeline remains invisible in basic attribution models because deals materialize from interactions you can't track (a colleague shares an internal link, a CEO reads your content offline, a customer receives a printed case study). This isn't a failure of your system; it's the nature of B2B sales.
What you can do: survey closed customers about their journey. Ask "where did you first hear about us?" and "what content mattered most?" Use this feedback to inform your model. Accept that you'll never track 100%, but you can catch 80%+ with honest effort.
Mixing Multiple Attribution Models Without Clear Ownership
Some teams use last-click for ad performance, linear attribution for content, and custom rules for email. This fragmentation makes it impossible to see how channels work together. A blog post attributed 100% as the converter in one system and 0% in another creates cognitive dissonance and wrong decisions.
Fix: choose one primary attribution model for your organization and stick with it for 12 months minimum. Let everyone reference the same "source of truth." You can run secondary models in parallel for comparison, but one model should drive budget decisions.
Conclusion
Traffic attribution reveals which content actually drives revenue—a view that vanishes under last-click measurement. The shift to multi-touch attribution isn't optional anymore for founders optimizing for growth. Organizations that implement proper multi-touch attribution see 15–30% higher marketing ROI, 27% lower customer acquisition costs, and 1.7x faster revenue growth compared to peers using last-click. The content pieces you're underinvesting in today are likely the ones your best customers discovered first. The blog posts you're considering cutting might be driving 40% of your deals.
Building attribution capability takes work: unified data infrastructure, the right attribution model, consistent tagging, and honest measurement. But the payoff is massive. You'll optimize budget toward high-impact content, stop wasting resources on vanity metrics, and finally understand which content stages move deals. For busy founders, automated content systems that handle research, writing, publishing, and attribution-friendly structure from the start eliminate the overhead of scaling content while maintaining measurement rigor. Start tracking your true revenue drivers today—and watch your unit economics improve.
FAQs
What attribution model should I use for my B2B SaaS business?
For most B2B SaaS, multi-touch linear or data-driven attribution works best. Linear attribution divides credit equally across all touchpoints, which works well if your buying cycle is 30-90 days and your customers follow roughly similar paths. Data-driven (algorithmic) attribution is better if you have 90+ day sales cycles, complex buying groups, or highly variable customer journeys. Data-driven models deliver 43% higher marketing ROI for top-performing brands but require more historical conversion data to train the algorithm. Start with linear if you're new to attribution, then upgrade to data-driven once you have 3-6 months of clean conversion history.
How long does it take to see revenue improvements from attribution?
Most organizations see measurable improvements within 3-4 months of implementing proper multi-touch attribution. The first month is usually setup and calibration. Months 2-3 reveal patterns in your customer journeys. By month 4, you'll have enough data to start reallocating budget confidently. The payback period is typically 3-6 months, after which the attribution system should be generating 3-6x returns through improved budget allocation and content decisions. Expect to see quick wins (stopping wasteful campaigns, shifting spend to high-impact content) before longer-term benefits (discovering content clusters that 3x revenue).
Can I implement attribution without hiring a data engineer?
Yes, if you choose the right tools and approach. Modern CDPs (Segment, mParticle) and analytics platforms (Amplitude, Mixpanel) can handle basic data unification without custom coding. If your tech stack is simple (Salesforce, Google Analytics, Mailchimp), you can connect these with a CDP and run attribution within 4-6 weeks. However, if you have legacy systems, custom databases, or highly customized implementations, you'll likely need engineering support to build data pipelines correctly. For busy founders who want to skip the data infrastructure headache, automated content systems that publish to your CMS while maintaining consistent tagging and internal linking eliminate most of the attribution complexity—the hardest part becomes much easier when your content is created with measurement in mind from day one.