Building Custom SEO Dashboards for Real-Time Monitoring
Most marketing teams waste 15+ hours every week pulling data from disconnected tools into spreadsheets, only to watch their reports grow stale by Friday. The problem? Traditional dashboards require manual data entry, react to changes after they've already hurt rankings, and fragment insights across a dozen platforms. Meanwhile, 78% of SEO agencies have shifted to API-driven automation for real-time monitoring, yet most lack the infrastructure to act on what they see. Real-time monitoring only matters if you can close the loop—detecting a ranking drop in 5 minutes is useless if you can't publish a corrective article in hours.
Key Takeaways
- 28% organic traffic increase achievable through data-driven SEO dashboards that surface actionable metrics (Beast Metrics, 2025)
- API-driven automation reduces dashboard setup time from 15+ hours to under 30 minutes, enabling scalable monitoring (Beast Metrics, 2025)
- Dashboard ROI depends on operational speed: detect issues in real-time, but act within hours through automated content workflows
Quick Dashboard Setup: Five Core Principles
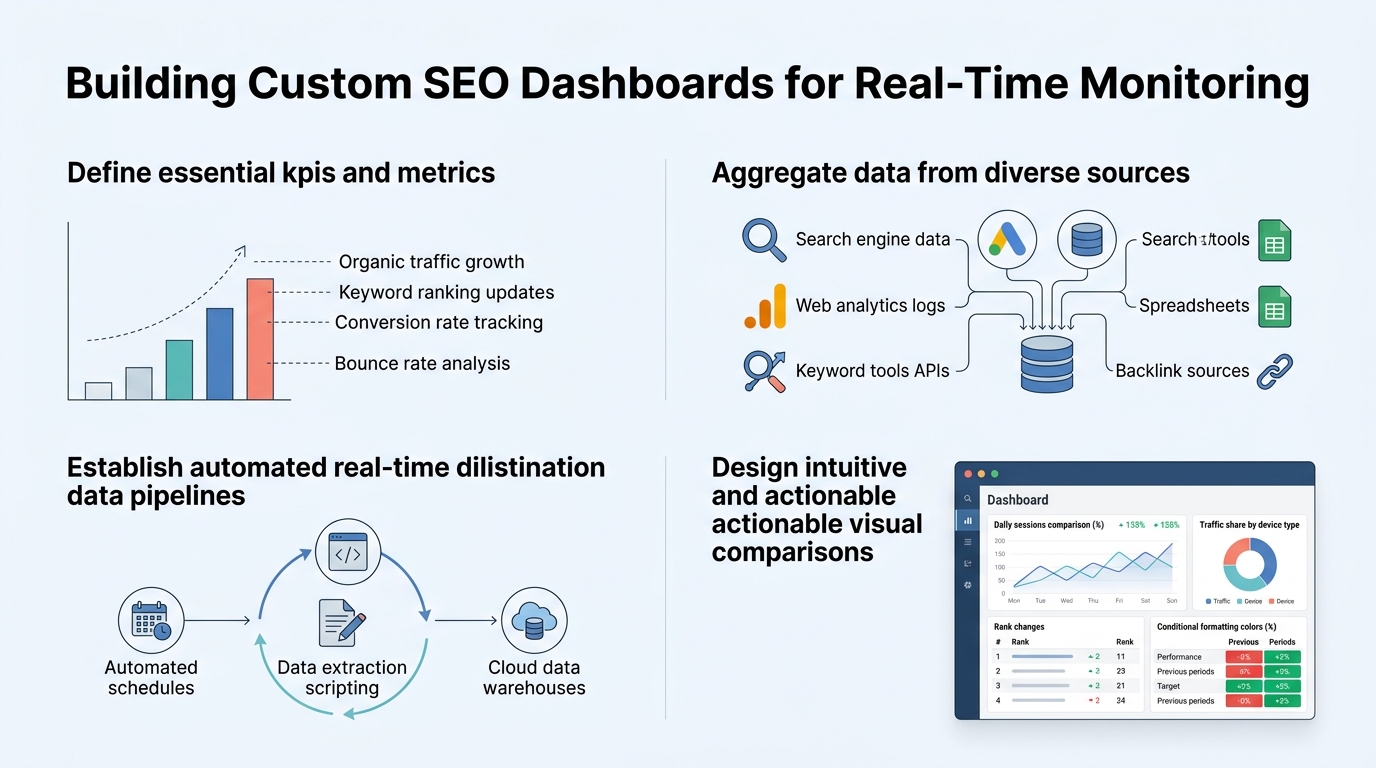
- Define Core Metrics (5-7 KPIs): Focus on organic traffic, keyword rankings, conversions, crawl health, and Core Web Vitals rather than vanity metrics.
- Connect via API Architecture: Pull live data from Google Search Console, Google Analytics 4, Ahrefs, and Screaming Frog without manual refresh.
- Design for Stakeholders: Create role-based dashboards—executives see business impact, teams see technical breakdowns.
- Automate Detection and Response: Use alerts to trigger playbooks: ranking drops trigger content audits, crawl errors trigger technical fixes.
- Measure Dashboard Impact: Track time-to-insight and time-to-action as KPIs, not just the metrics themselves.
What Metrics Matter Most in a Real-Time SEO Dashboard?
The average SEO professional tracks 20-30 metrics monthly, yet only 5-7 actually drive decisions. Noise kills dashboards. Executives lose trust in dashboards because they're drowning in indicators that don't connect to revenue. The fix is ruthless prioritization. Start with metrics that directly link to organic traffic and conversions, not auxiliary data that looks impressive but leads nowhere.
"Dashboard success depends on answering one question: Does this metric move a business lever? If not, hide it."
Organic Traffic and Visibility Metrics
Organic traffic volume is your north star. Track it by channel, device, and landing page type to spot where your content works and where it stalls. 65% of companies report better SEO results when dashboards integrate AI-powered anomaly detection that flags traffic shifts before they cascade into lost revenue. Don't just plot traffic over time—segment by device (mobile CTR often diverges from desktop), traffic type (branded vs. non-branded keywords drive different value), and content pillar (product content vs. educational content convert differently). Visibility metrics like estimated organic impression share and keyword rank position matter only as leading indicators. Use them to predict traffic changes 2-3 weeks ahead.
Keyword Rankings and SERP Features
Rank tracking alone is theatrical. What matters is whether your keywords moved into featured snippet positions, People Also Ask, or top-10 real estate. Ahrefs updates backlink data every 15 minutes for high-traffic sites, and rank tracking should match that cadence for competitive verticals. Build rank visualizations that show:
- Keyword position buckets (top 3, 4-10, 11-30, 31-100)
- SERP feature ownership (featured snippets, videos, knowledge panels)
- Search intent alignment with your content
- 30-day trend direction (moving up or down)
Focus on keywords generating actual traffic, not theoretical ranking wins.
Conversion and ROI Indicators
Organic traffic without conversion data is a vanity metric. Layer conversion rate, cost-per-acquisition, and content ROI into your dashboard so team decisions map to revenue. Create a conversion funnel view that shows:
- Clicks from search results
- Page views and engagement time
- Conversions (leads, signups, purchases)
- Revenue per traffic source
Identify your top 10 content pieces by revenue contribution, not page views. This reframes how you prioritize content updates and link-building efforts—you'll invest in pages that drive deals, not just rankings.
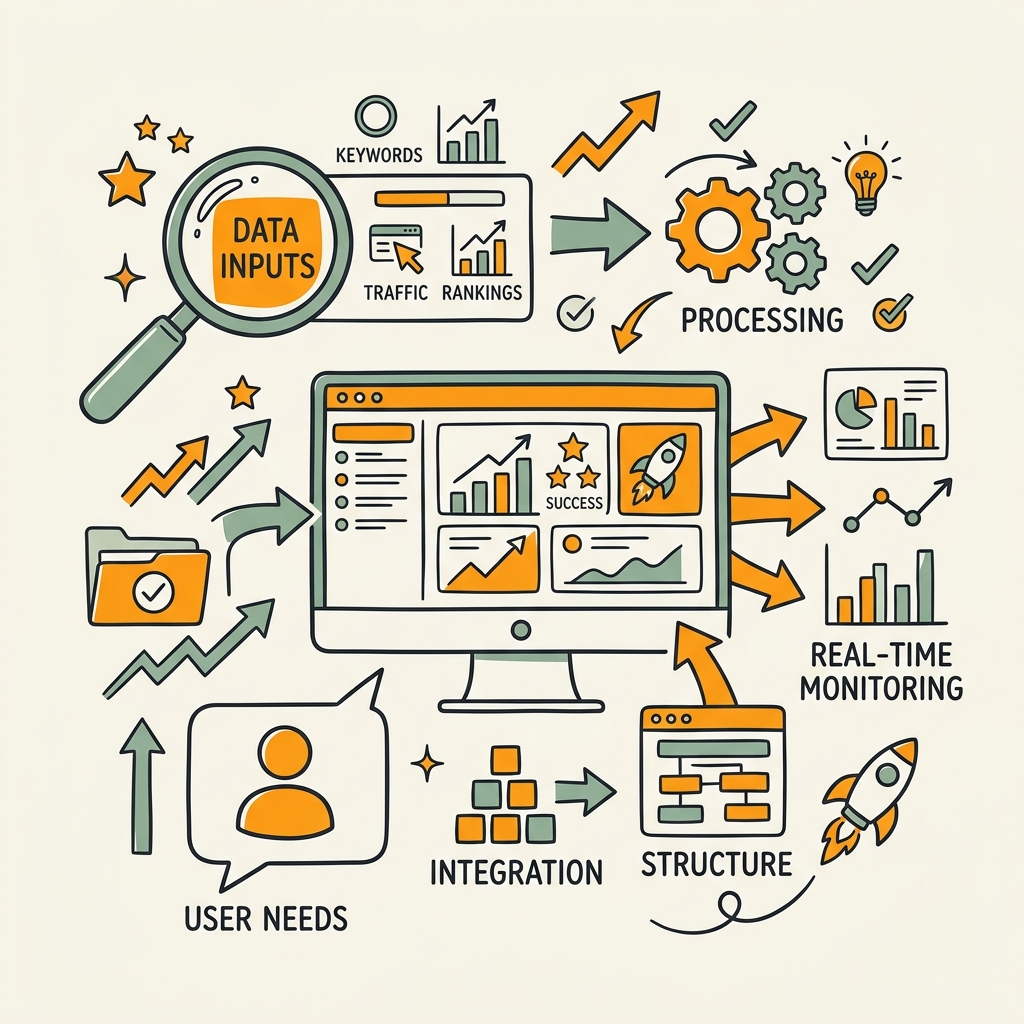
How Do You Design a Custom Dashboard Architecture?
Most dashboards fail not because the metrics are wrong, but because the data pipeline breaks within weeks. You build it once, API keys rotate or tools change their API structure, and suddenly you're staring at red error states instead of insights. Custom architectures require modular design, automated data freshness checks, and role-based views that keep executives happy without overwhelming teams.
Choosing Your Data Stack and API Sources
A modern SEO dashboard pulls from 4-6 core sources: Google Search Console (traffic, CTR, impressions), Google Analytics 4 (user behavior, conversions), rank tracking tools (Ahrefs, SE Ranking), technical audit tools (Screaming Frog), and optionally, backlink sources. Nightwatch's NightOwl and Sight AI's 13+ AI agents enable autonomous 24/7 monitoring for AI visibility and instant indexing. Start with Google's free APIs (Search Console, PageSpeed Insights). Clickrank recommends connecting PageSpeed Insights API for Core Web Vitals tracking on scheduled intervals, then pair with paid tools only if you have budget and team bandwidth to maintain integrations.
Choose a visualization layer: Looker Studio (free, integrates directly with Google APIs), Tableau (enterprise, steeper learning curve), or custom builds with Python/Node.js (maximum control, highest maintenance cost). For most growing companies, Looker Studio is the pragmatic choice—it connects to 800+ data sources, requires zero coding, and updates live as data flows in.
Setting Up Real-Time Data Pipelines
Real-time doesn't mean every second. For most SEO teams, "real-time" means data refreshes hourly or every 6 hours, with alerts firing for exceptions. seoClarity's Content Guard detects page changes in under 5 minutes on average, making it viable for teams managing high-traffic sites. Here's how to structure the pipeline:
- Use a scheduler (IFTTT, Zapier, or a simple cron job) to run API pulls on a cadence—hourly for traffic data, 2x daily for ranking data, weekly for backlink data
- Store raw data in a simple database (Google Sheets, Airtable, or PostgreSQL if you have engineering support)
- Transform that raw data into calculated metrics—week-over-week growth, month-over-month variance, anomaly flags
- Visualize in your dashboard layer with filters and drill-downs for deep analysis
The key to durability is error handling. Test API connectivity daily, log failures, and trigger alerts if data hasn't updated within its expected window. Nothing kills trust faster than a stale dashboard masquerading as real-time.
Building Role-Based Dashboards for Different Audiences
One dashboard serves nobody well. Create three distinct views:
- Executive Summary (1-2 pages): Organic traffic trend, revenue impact, top keywords
- Team Operations Dashboard: Keyword rankings, technical audits, content performance by pillar
- Analyst Deep-Dive: Raw metrics, segmentation options, anomaly logs
Use filters and drill-downs aggressively so anyone can navigate from summary to detail without creating new reports. Executives care about organic traffic as % of total traffic, organic revenue contribution, and month-over-month growth rate—they'll look at it once a week. Teams care about which pages are ranking well, which need updates, and technical issues blocking crawl—they'll check it daily. Analysts care about everything and will live in the data.
What Role Does Automation Play in Dashboard-Driven SEO?
A dashboard that only shows problems is reactive. A dashboard that triggers playbooks is strategic. 78% of SEO agencies use API-driven automation for real-time monitoring, yet most treat dashboards as reporting tools instead of action levers. The real win is when a dashboard alert fires, a workflow activates, and a corrective action completes before the issue propagates to your rankings.
"The teams winning at SEO are not the ones with the best dashboards. They're the ones with the fastest feedback loops between insight and action."
Connecting Dashboards to Content and Technical Workflows
When your dashboard detects a keyword drop, the next question is: why? Content outdated? Technical issue? Backlink loss? A smart dashboard links that alert to a workflow. Example: If organic traffic from pillar A drops 10% week-over-week, a workflow could automatically: flag content in that topic cluster for review, pull competitive SERP data, suggest keywords to target in new content, and draft a brief for the writing team. Most teams handle this manually—opening Ahrefs, checking rankings, searching for content gaps, drafting notes. An autonomous SEO agent handles this discovery in minutes, feeding research directly into your content pipeline so teams ship updates fast.
Similarly, when technical audits surface crawl errors, a workflow routes them to dev or SEO teams with severity levels and actionable fixes. When backlink alerts fire, sales teams can be notified of brand mentions to reach out to for links.
Alert Thresholds and Severity Scaling
Alert fatigue kills dashboards. Firing an alert for every 1% traffic variance generates noise. Set intelligent thresholds based on the following severity scale:
- Critical alerts: Indexing issues (drops >5%) — Slack/SMS immediate notification
- Warnings: Ranking shifts (drops 3-5%) — Daily digest compilation
- Informational: Trending data (traffic up 15%) — Weekly team review
Base thresholds on your baseline volatility—high-traffic sites see more natural noise than new sites. Route alerts by severity and owner so critical issues go to Slack/SMS immediately, warnings go to daily digests, and trending insights go to weekly team reviews. This channels urgency appropriately instead of desensitizing teams to every blip.
Automated Response Playbooks Triggered by Dashboard Conditions
The most sophisticated teams have playbooks that activate without manual intervention. Examples include:
- If organic traffic from content topic X drops, auto-generate a list of the top 10 ranking competitors in that space
- If Core Web Vitals fail on 3+ pages, trigger a performance audit and notify dev teams
- If a critical keyword loses top-10 position, queue a content refresh task
- If new branded mentions appear (via backlink alerts), trigger outreach workflows
These playbooks don't need to be complex—a simple Zapier or Make workflow can handle most. The power is in reducing the time between insight and action. Most teams see a ranking drop on Monday, discuss it in Tuesday's standup, and start fixing Wednesday. Automated playbooks compress that to Monday afternoon.
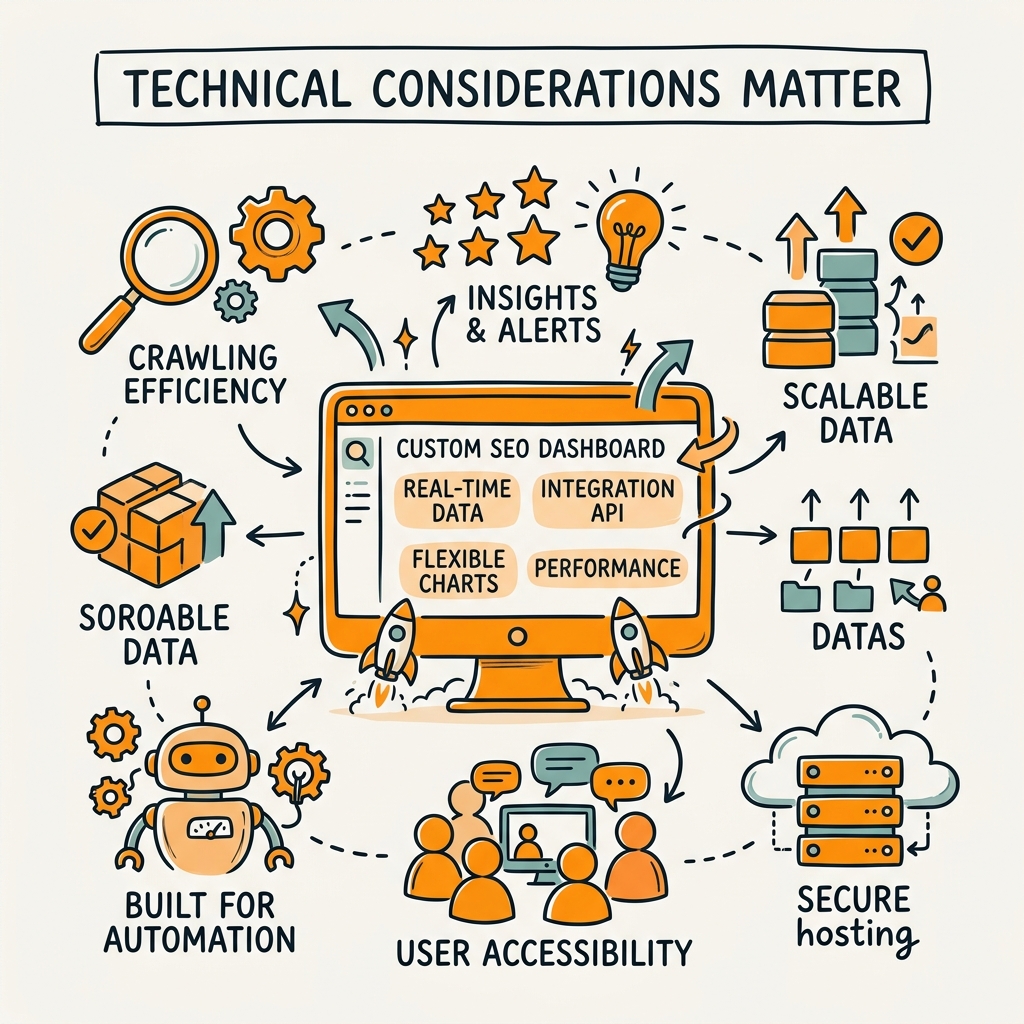
What Technical Considerations Matter When Building a Custom Dashboard?
Most custom dashboards fail for technical reasons, not strategic ones: API authentication breaks, data formats change, rate limits get hit, or data freshness checks fail. Plan for these from day one or your beautiful dashboard becomes a maintenance burden.
API Authentication, Rate Limits, and Data Freshness
Every API you connect has rate limits. Google Search Console allows 600 queries per 10 seconds; Ahrefs limits requests based on plan tier. Design your refresh schedule around the most restrictive API. If you're hitting rate limits, you're pulling too frequently or too much data at once. Use pagination, date ranges, and filtering to minimize request volume. Store API keys securely—never hardcode them. Use environment variables and rotate keys quarterly.
Monitor data freshness explicitly. For every data source, log the last successful pull timestamp. If a pull fails or is stale (more than 2x the expected refresh interval), flag it visually in your dashboard so teams know they're looking at old data. This single practice prevents decisions based on stale information.
Handling Data Quality and Normalization Issues
Different tools calculate metrics differently. One tool's "organic traffic" includes branded keywords; another excludes them. One tool's keyword position is based on clicks, another on impressions. Normalize these before visualization. Document your calculation logic so teams understand what they're seeing. Create a data dictionary: keyword position defined as [tool used], organic traffic defined as [filters applied], conversion rate defined as [attribution model].
Build validation rules. If your dashboard shows 10,000% traffic growth in a single day, don't display it. Flag it as an anomaly and require manual review. Use statistical bounds to catch data errors before they mislead decision-makers.
Scaling Dashboards for Multi-Site and Multi-Client Environments
For agencies, scalability is critical. Design your dashboard architecture to handle N sites without N separate dashboards. Use parameterized data pulls (filter by domain) so one dashboard can display data for any site. Create a master dashboard showing all properties with toggle filters, then drilldown options to individual site dashboards. This reduces maintenance burden from 20 dashboards to 2-3 core templates.
Consider a data warehouse approach: pull raw data from all sources into a central database nightly, then feed visualizations from that warehouse. This decouples your visualizations from APIs, making dashboards faster and more stable.
How Should You Measure the ROI of a Custom SEO Dashboard?

A dashboard's value isn't in the metrics—it's in the decisions it enables and the time it saves. Measure dashboard ROI by tracking: time-to-insight (how fast do teams spot issues?), time-to-action (how fast do they respond?), decision quality (are actions based on clean data or hunches?), and ultimately, outcome impact (do these actions move organic traffic and revenue?).
Tracking Time-to-Insight and Decision Velocity
Before your dashboard, how long did it take to realize organic traffic dropped? A week? A month? After your dashboard, it's instant—an alert fires and teams know. Quantify this: "Our dashboard detects traffic anomalies 7 days faster than our previous weekly reporting." That speed is worth money.
Similarly, measure decision velocity. Record the time from issue detection to action start. If a dashboard alert fires at 10 AM and content teams have a brief drafted by 11 AM, that's exceptional. Most teams take 24-48 hours. A custom dashboard can compress this to hours, freeing up team capacity for new initiatives.
Quantifying Content and Technical Improvements
Link dashboard insights directly to outcomes. Example: "Our dashboard identified 12 content gaps in the cloud infrastructure topic cluster. We filled 8 of them in Q2, generating 400 additional monthly organic visitors worth $12K in ARR." This makes dashboard investment tangible.
For technical improvements: "Our dashboard's crawl health monitoring surfaced 200 broken internal links in 2 hours. We fixed them in 6 hours. This prevented an estimated 8-15% organic traffic loss." Assign a dollar value to each improvement—even conservative estimates justify dashboard investment.
Building a Business Case for Dashboard Investment
Present the ROI calculation to stakeholders: Total time saved annually (hours × hourly cost) + Revenue gained from faster decisions + Risk prevented from early issue detection = ROI. For most teams, this is a 3-6 month payback on a custom dashboard build. Include the efficiency multiplier: teams equipped with real-time data make better decisions, meaning each decision generates higher ROI.
If building custom feels expensive, consider: Many teams spend 10+ hours weekly on manual reporting that a dashboard cuts to 1 hour. That's 450+ hours saved annually—easily $15-30K in salary cost recovered.
Which Tools and Platforms Excel at Custom SEO Dashboards?
The landscape has shifted dramatically toward API-first platforms and automated monitoring. Here's how current leaders stack up:
| Tool | Real-Time Capability | API Strength | Starting Price | Best Use Case |
|---|---|---|---|---|
| Looker Studio | Hourly (limited by data source) | Excellent—800+ integrations, native Google APIs | Free | Budget-conscious teams; Google Data focus |
| Ahrefs | 15-min backlink updates | Strong Site Explorer API; rank tracking | $99/mo | Backlink monitoring; competitive analysis |
| Nightwatch (NightOwl) | Hourly crawls; AI agent automation | GSC/PageSpeed integration; LLM tracking | $39/mo | Agencies; AI visibility; multi-client setup |
| SE Ranking | Daily rank updates; GA4 integration | Rank tracker API; backlink monitoring | $55/mo | Rank tracking at scale; multi-site agencies |
| seoClarity Content Guard | <5-min page change detection | Custom alerts; Slack/SMS integration | Enterprise (custom) | Enterprise teams; proactive monitoring |
For most growing companies, Looker Studio + Google APIs is the no-code entry point, and Nightwatch or SE Ranking add agency-grade automation. If you have technical chops, build custom dashboards pulling from raw APIs (Ahrefs, SEMrush, GSC) into Looker Studio or a data warehouse like BigQuery.
What's the Connection Between Dashboards and Content Velocity?
Here's the insight most teams miss: Your dashboard is only as useful as your ability to act on it. Content marketing ROI depends on closing the gap between insight and publication. A dashboard that shows a 30% organic traffic drop in a traffic segment is useless if it takes your team 3 weeks to write a corrective article. Conversely, a dashboard that feeds into automated content research and ideation can produce drafts within hours, enabling teams to act while the window is still open.
The most sophisticated SEO operations pair real-time monitoring dashboards with high-velocity content production. When the dashboard surfaces a keyword opportunity or a competitive gap, a content workflow immediately springs into action—AI agents research the topic, populate a brief, and hand it off to writers. This compresses the cycle from weeks to days, magnifying dashboard value.
SEO automation powered by AI agents turns dashboard alerts into live content in hours, not weeks. When you can detect an opportunity and publish an answer page to compete for search traffic within the same business day, your dashboard becomes a growth lever instead of a reporting tool.
Conclusion
A custom SEO dashboard is not a luxury—it's the foundation of competitive organic growth. Teams that build them realize 28% higher organic traffic and reduce time-to-insight from days to minutes. The technical barrier has evaporated: free tools like Looker Studio, free APIs from Google, and low-code platforms make professional dashboards accessible to any team.
Start with your top 5-7 metrics, connect them via API, and iterate. The sophistication comes later—AI-driven anomaly detection, automated alert workflows, multi-site scaling. Most importantly, link your dashboard to action. An insight that doesn't trigger a response is just noise.
For teams managing content at scale, dashboard-driven decisions become exponentially more powerful when paired with content velocity. Real-time monitoring that feeds into fast content production is where the multiplier effect happens. Start your SEO agent today and turn dashboard insights into published content that compounds your organic growth.
FAQs
What metrics should a real-time SEO dashboard prioritize?
Focus on organic traffic, keyword rankings in top 10, conversion rate, and Core Web Vitals as your primary 5-7 KPIs. Avoid vanity metrics like total keywords tracked or pages crawled—they don't drive decisions. Segment organic traffic by content pillar and device to spot where your content converts and where it stalls. Add conversion metrics (leads, signups, revenue per source) so every metric ladder up to business outcomes. Dashboard design should make it obvious: this is the traffic you're winning, this is where you're losing, and here's what to do about it. Layer in competitive rank positions for your top 10 keywords so you can spot when you're losing ground and act fast.
How often should dashboard data refresh for it to be truly real-time?
Hourly refresh is practical real-time for most teams. Google Search Console data is typically delayed by 1-3 days, so even a 24-hour refresh captures fresh insights. For traffic alerts, hourly is ideal so you catch anomalies same-day. Rank tracking can refresh 2x daily since keyword positions shift gradually. Backlink and technical audit data can refresh weekly—these don't change fast enough to warrant hourly checks. Real-time is relative: aim for data fresh enough to spot issues before they impact revenue, not for second-by-second updates. Set refresh schedules within your API rate limits; hitting rate limits breaks your pipeline entirely. Test your refresh schedule for 2 weeks to ensure all APIs consistently complete within their windows, then lock it in.
Can a non-technical team build a custom SEO dashboard without coding?
Yes—Looker Studio and Zapier make no-code dashboards accessible. Connect Looker Studio directly to Google Search Console and Google Analytics 4 (free), choose visualization types (line charts for trends, scorecards for KPIs), and publish. For data from non-Google tools (Ahrefs, SE Ranking), use Zapier or Make to pull data into Google Sheets daily, then visualize in Looker Studio. This requires zero coding and takes a few hours to set up. The limitation is flexibility—no-code tools work best when your data sources align with pre-built connectors. If you need custom calculations or want to pull from 5+ APIs simultaneously, you'll want engineering support. Start no-code, measure the value, then upgrade to custom builds only if the ROI justifies the engineering investment.