Building Custom SEO Reports That Save Time
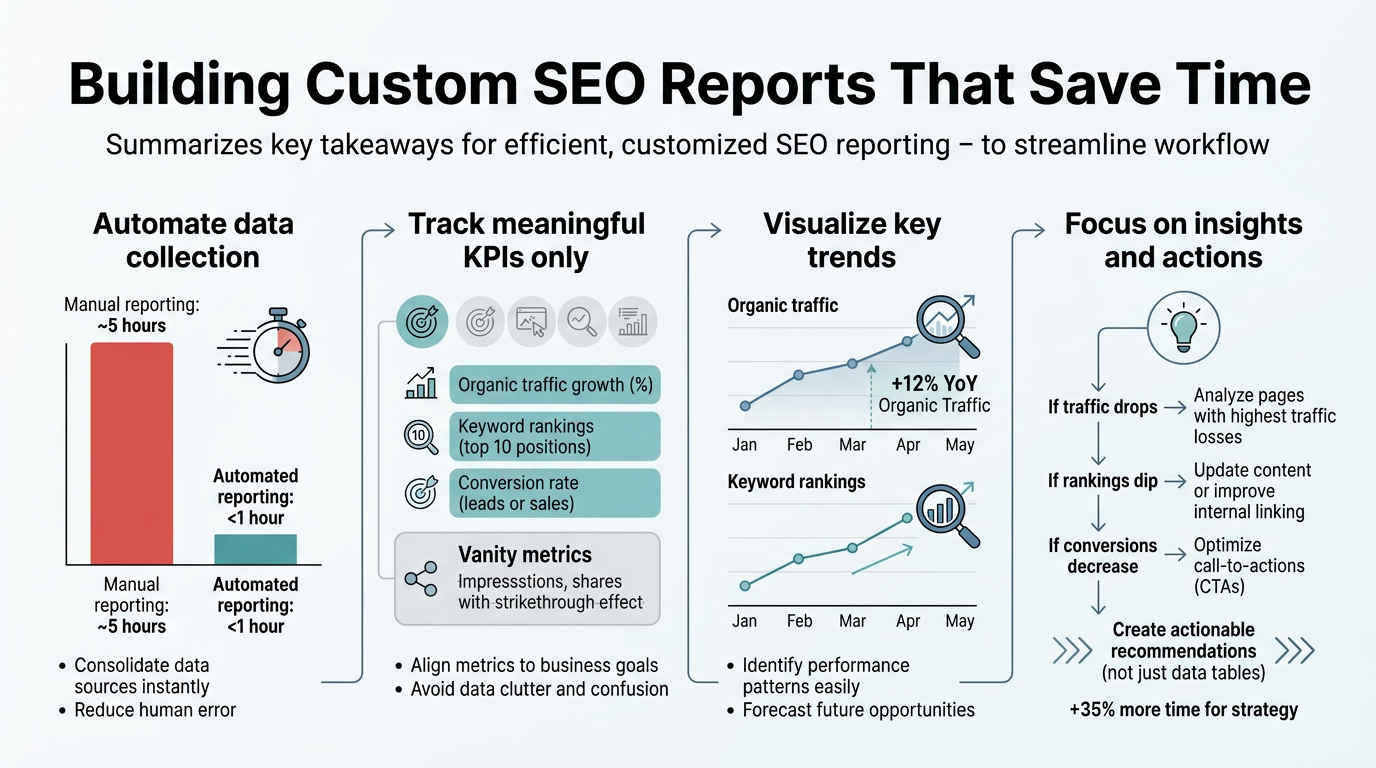
Your team spends 6–12 hours per month per client manually assembling SEO reports from scattered data sources. That's not a reporting problem—it's a margin problem. Marketing managers report that 75% of SEO professionals now use automation for reporting, yet most teams still handstitch dashboards, wrestle with inconsistent formatting, and miss deadlines while chasing data across Google Search Console, analytics platforms, and rank trackers.
The fix isn't buying another tool. It's designing a custom reporting system that connects your actual data sources, surfaces the metrics that matter to your clients, and publishes automatically. Here's a quick summary of how to build SEO reports that eliminate the busywork.
Key Takeaways
- Automated SEO reporting saves 8–15 hours per week while improving client satisfaction by 91% (Beast Metrics, 2026)
- Manual reporting costs agencies $20K–$60K annually per team pod in lost strategic time
- Custom reports focused on business outcomes (revenue, leads) outperform vanity metrics by 3–5x in client retention
- Define Your Core KPIs: Align metrics to client business outcomes—revenue impact, lead generation, or visibility—rather than keyword counts.
- Connect Your Data Sources: Integrate GSC, GA4, rank trackers, and backlink platforms in a single reporting dashboard to eliminate manual pulls.
- Design Modular Templates: Create white-label report templates that auto-populate with fresh data, then customize per client in minutes.
- Automate Data Delivery: Schedule reports to send automatically on a fixed cadence, cutting your weekly distribution overhead to zero.
- Layer in Anomaly Detection: Flag ranking drops, traffic shifts, and indexation issues automatically so you catch problems before clients ask.
Why Custom SEO Reports Are Worth Building
Most teams treat reporting as a tax—something invoiced to clients but tolerated internally. Automated reporting flips that equation. Agencies using custom, data-driven reports report 47% fewer client support inquiries and 40% higher client acquisition rates because consistent, transparent reporting builds trust faster than sporadic ad-hoc updates.
"Agencies using automated reporting see 47% fewer client support inquiries and 40% higher client acquisition rates because consistent, transparent reporting builds trust faster than sporadic ad-hoc updates." — Industry data from Beast Metrics, 2026
The economics are brutal if you're still assembling reports manually. A fully loaded strategist at $85–$140 per hour, shipping 20 reports monthly, costs $20K–$60K annually just in prep time. That's margin that evaporates before you deliver strategy. Building automated reporting into your content strategy ensures every piece of content is tracked, measured, and fed into client dashboards automatically.
Custom reports also unlock a secondary benefit: data narratives. Instead of raw dashboard screenshots, your reports can surface trends, anomalies, and wins in language clients actually care about. An automated system that highlights "organic traffic grew 23% month-over-month because rankings improved on your top 12 commercial keywords" lands harder than a table of keyword positions.
Step 1: Define Your Core KPIs Before Building Anything
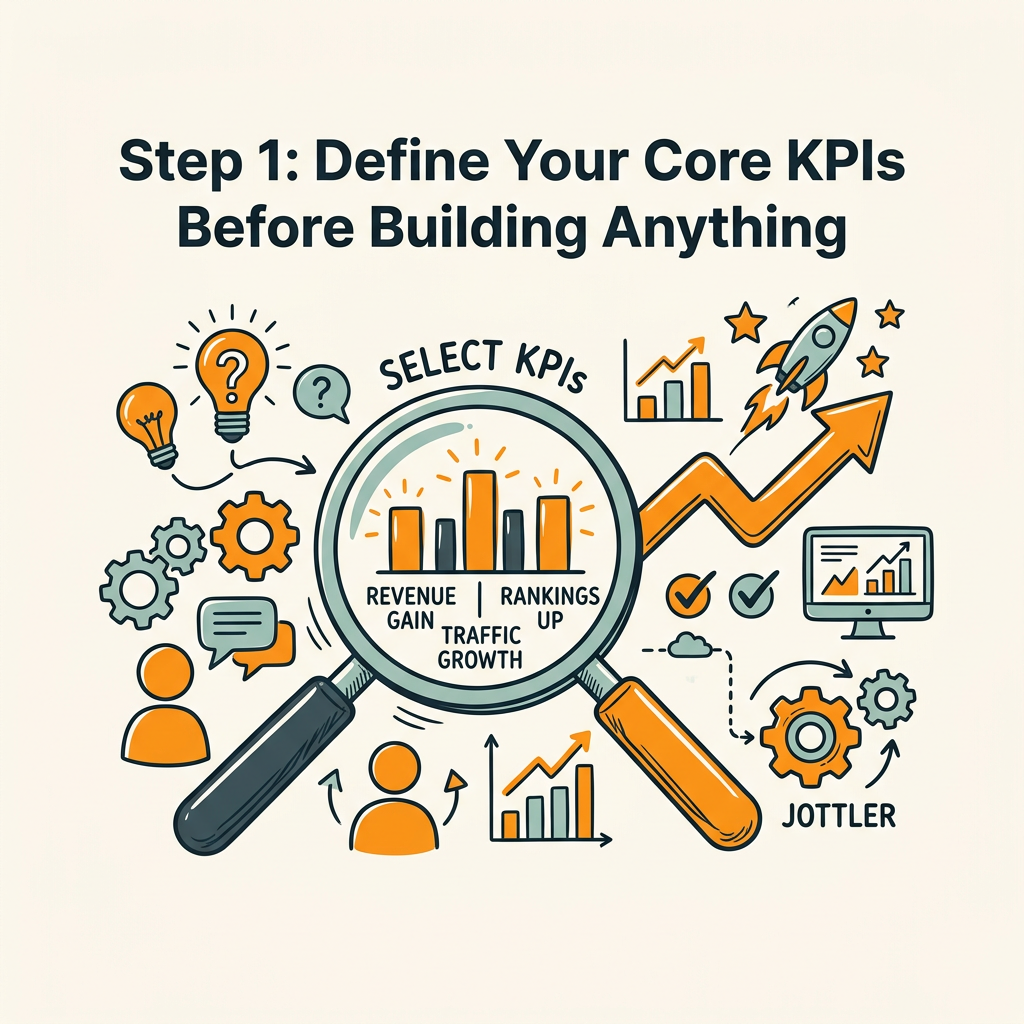
Most reporting failures start with the wrong metrics. Teams pick what's easy to track (keyword rankings, impressions) instead of what matters to the business (revenue, leads, customer acquisition cost).
Before you touch a dashboard tool, sit with your client and map their business outcomes. Not "we want better rankings"—that's a symptom. Ask:
- What outcome moves the needle for your business? Revenue? Qualified leads? Demo requests?
- How does organic traffic connect to that outcome? Do visitors convert at different rates by keyword intent?
- What's the baseline? How many organic leads are you getting today, and what's your target?
- How often do you need visibility? Weekly dashboards or monthly executive summaries?
This conversation shifts reporting from vanity metrics to accountability metrics. A SaaS client doesn't care about ranking position 5 or 7—they care that organic revenue grew $15K this quarter.
"A SaaS client doesn't care about ranking position 5 or 7—they care that organic revenue grew $15K this quarter. That's where your KPI hierarchy should live." — SEO Strategy Best Practice
Pro tip: Create a KPI hierarchy. Primary metrics (revenue, leads) live in the executive summary. Secondary metrics (traffic, conversions, rankings) support those in the detailed section. This structure works for all clients; only the numbers change.
Step 2: Choose Your Data Architecture
Custom reporting requires pulling data from multiple sources. Your choices are: manual export, platform-native dashboards, or unified reporting platforms.
Manual Exports (Spreadsheets and Google Sheets)
This is how most teams start. Pull CSVs from GSC, GA4, and your rank tracker, paste into a master sheet, format for client. It feels fast at first. Until you do it 20 times monthly.
Costs: 4–6 hours per week in pure data entry and formatting. Error rate climbs as you scale (wrong tabs, outdated numbers, inconsistent formatting). Not recommended unless you have fewer than 3 clients.
Platform-Native Dashboards (Looker Studio, Power BI)
Google Looker Studio is free and integrates tightly with Google Analytics and GSC. You can build attractive, auto-updating dashboards in hours. The limitation: it's siloed to Google products. If you track rankings, backlinks, or use non-Google tools, you'll still need manual data pulls for those layers.
Use this if your clients live almost entirely in the Google ecosystem and you want zero infrastructure cost.
Unified Reporting Platforms (Whatagraph, DashThis, Improvado)
These consolidate data from 100+ sources—Google Ads, Meta, LinkedIn, GSC, GA4, rank trackers, CRMs—into one dashboard. Automated reporting platforms save teams 70% of report prep time by eliminating manual data pulls entirely. You design once, then let the system pull fresh data and update dashboards every morning.
Cost–benefit: Unified platforms cost $30–$300/month per seat, but each one displaces 4–8 hours of manual work weekly. For agencies managing 10+ clients, the ROI is clear: pay $100/month to reclaim $1,200+ in labor.
Step 3: Design Modular Report Templates
Custom doesn't mean building each report from scratch. It means designing flexible templates that auto-populate for each client, then customizing the narrative and KPIs per engagement. When paired with a comprehensive SEO automation system, your templates can pull directly from performance data that's already being tracked and optimized.
The Three-Section Framework
Executive Summary (1 page). One metric: did we move the needle? E.g., "Organic revenue: $18K → $22K." A single chart showing trend. Done.
Performance Overview (2–3 pages). Core SEO metrics: traffic, rankings, conversions, on-page performance. Data visualized simply (line charts for trends, bar charts for comparisons).
Detailed Analysis (2–4 pages). Deep dives: keyword performance, technical audits, backlink wins, content recommendations. This is where insights live—not raw data.
Template principle: Same structure for all clients; only data and commentary change. One report template, swapped for 20 clients. That's where the time savings compound.
White-Label and Brand Customization
Use your logo, your colors, your domain in the report URL. Clients shouldn't see "Powered by [Tool]"—they should see professional assets that look like they came from your agency.
Most modern reporting platforms offer white-label options. When you're running an autonomous SEO operation, every component—from content creation to reporting—carries your brand voice consistently.
Step 4: Automate Data Integration and Delivery
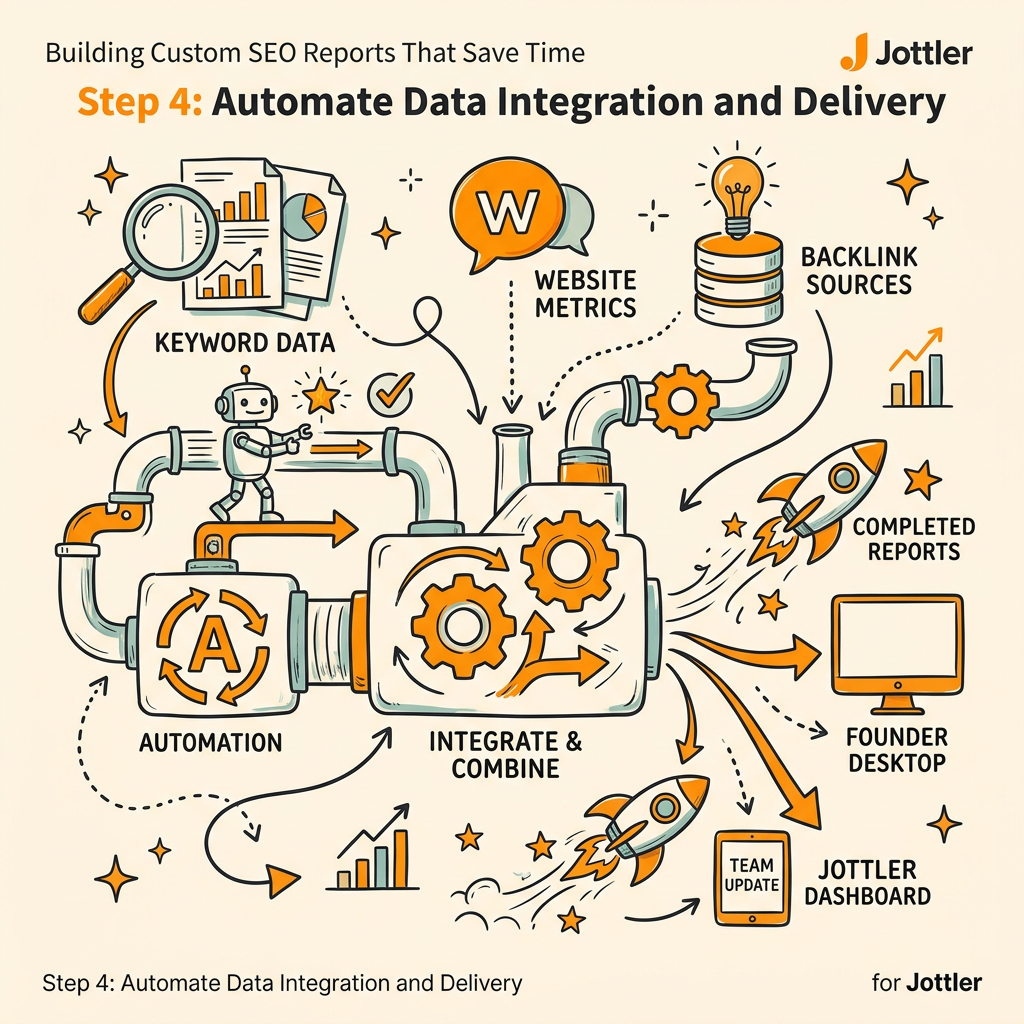
The real time savings come from removing yourself from the delivery pipeline. Once data flows automatically and reports generate unattended, your team moves from "report doer" to "insight reviewer."
Connect Your Data Sources
Most reporting platforms offer one-click integrations with:
- Google Search Console (impressions, clicks, rankings, indexation)
- Google Analytics 4 (traffic, conversions, user behavior)
- Rank trackers (Semrush, Ahrefs, SE Ranking)
- Backlink platforms (Moz, Ahrefs, Domain Authority shifts)
- CRM data (HubSpot, Salesforce—so you can tie organic to pipeline)
- Paid advertising (Google Ads, Meta for competitive context)
Once connected, data syncs hourly or daily. No manual exports. No delays.
Schedule Automatic Report Delivery
Set a cadence: monthly on the first Monday, weekly every Friday at 9 AM, quarterly executive summaries. The system generates fresh reports, adds them to a branded portal, and emails clients automatically. You can be offline.
This is where 70% of manual time evaporates. No more "I need to finish the report by EOD"—it's done while you sleep.
Step 5: Layer in Anomaly Detection and Alerting
Proactive reporting beats reactive. Modern reporting systems flag changes automatically:
- Ranking drops: Alert if rankings fall >5 positions on commercial keywords
- Traffic shifts: Notify if organic traffic drops >20% MoM
- Indexation issues: Flag crawl errors, deindexing, or robots.txt blocks
- Conversion changes: Surface if CPC rises or conversion rate drops below trend
- Competitive moves: Alert when competitors outrank you on your top keywords
You catch problems before clients do. That responsiveness deepens trust and justifies ongoing investment in SEO.
Comparing Popular Custom Reporting Approaches
| Approach | Time Per Report | Setup Cost | Monthly Cost | Data Sources | Automation Level |
|---|---|---|---|---|---|
| Google Sheets + CSV Export | 3–5 hrs | Free | $0 | Manual (Google only) | None |
| Looker Studio | 30 min (after setup) | 4–8 hrs setup | Free | Google ecosystem | Automated data refresh |
| Whatagraph / DashThis | 15 min (after setup) | 6–12 hrs setup | $60–$200 | 100+ platforms | Full automation + AI insights |
| Jottler (Content + Reporting) | 0 hrs (fully autonomous) | Setup + custom integration | $29+ (starting price) | All major platforms + CMS | AI agents handle research, writing, and reporting |
The comparison reveals a crucial insight: unified platforms with automation save 80–90% of manual time, but they still require you to design templates and interpret data. Jottler's advantage is that it automates not just reporting, but the entire content-to-insights pipeline. Your team doesn't just receive reports—they receive AI-generated content strategy, keyword research, and internal linking recommendations tied directly to performance data. It's reporting with a strategic backbone.
Best Practices for Building Custom Reports Your Clients Actually Read

Automation is only half the battle. The report still needs to communicate value.
Lead with the Outcome, Not the Data
Don't: "Impressions grew 12%, clicks grew 8%, CTR fell 3%."
Do: "Organic traffic grew 8% this month, generating 47 new qualified leads—our target pace for Q3."
The data supports the narrative; the narrative drives decisions.
Highlight Wins and Learnings
Every report should surface 2–3 concrete wins and 1–2 learnings. Wins build confidence. Learnings justify investment. "We cracked the top 3 for 'commercial keyword'—here's what worked and how we'll apply it to adjacent terms." Boom. That's a report worth reading.
Tie Metrics to Strategy
Each metric should answer a question: "Is our strategy working?" If it's not directly tied to strategy, it's noise. Research shows agencies that align reporting to business outcomes see 91% improvement in client satisfaction, not just visibility. Your SEO strategy needs to be grounded in measurable outcomes, not activity metrics.
Use Visuals Thoughtfully
A trend line is worth 50 data points. A waterfall chart showing traffic sources is cleaner than a table. But don't oversaturate—three good charts beat twelve mediocre ones. Jottler embeds performance data across its AI-driven SEO tools, so reporting visuals are clean, focused, and directly tied to content performance.
Common Pitfalls to Avoid
Even well-intentioned reporting systems fail. Here's what kills them:
- Vanity metrics over business metrics. Ranking position doesn't matter; revenue does. Fix your KPIs first.
- Too much data, too little insight. Clients don't need every metric. They need the 3–5 that matter. Simplify ruthlessly.
- Static reports. If you're manually updating the same template each month, you've built a time sink, not a system. Automate or abandon.
- Misaligned cadence. Quarterly reports for fast-moving businesses feel stale. Weekly reports for slow-moving ones create noise. Ask clients their preference.
- No ownership of the narrative. Automation can pull data, but you must add insights. If reports feel generic, clients won't trust them.
Scaling Custom Reporting Across Multiple Clients
One custom report is nice. Twenty custom reports on autopilot? That's a competitive moat.
The scaling strategy is template standardization + data automation. Once you've nailed your three-section framework with one client, clone it for 19 others. Only the KPIs, logos, and narrative commentary change. Data pulls automatically. Delivery is scheduled.
This is where modern SEO automation tools unlock margin recovery—a single reporting setup displaces hours across your entire client roster, month after month. Over a year, that's 100+ hours reclaimed. That's strategic time. That's new client acquisition. That's growth.
Jottler integrates directly into your workflow: it researches, writes, and publishes content while logging every optimization it made, every keyword it targeted, and every result. That same data feeds directly into client reports automatically. Your reporting system and your content system aren't separate—they're aligned, feeding each other intelligence.
Conclusion
Custom SEO reporting stops being a burden when you automate the data layer and design your templates once. The evidence is clear: teams using automated reporting reclaim 8–15 hours weekly, reduce client support inquiries by 47%, and improve retention by 91%. That's not just time savings—it's competitive advantage.
Start by defining your KPIs. Connect your data sources to a unified reporting platform. Build your template once. Schedule automatic delivery. Then let the system run while your team focuses on strategy and growth.
Ready to eliminate manual reporting entirely? Start your SEO agent to automate not just reporting, but the entire research-to-insights pipeline that powers it. Stop assembling reports. Start shipping strategy.
FAQs
How much time does automated SEO reporting actually save?
Automated SEO reporting saves 8–15 hours per week on average. Most teams spend 4–6 hours per week collecting data from multiple sources, 2–3 hours formatting and designing reports, and 1 hour delivering to clients. Automation collapses that to under 1 hour of review and insight-writing per week. For agencies managing 10+ clients, that compounds to 100+ hours reclaimed annually—enough to acquire 2–3 new clients or redeploy a team member to strategy work.
What metrics should I include in a custom SEO report?
Focus on business-outcome metrics first: revenue, leads, conversions, and customer acquisition cost. Then add SEO-specific context: organic traffic trend, keyword rankings on your top 20 commercial terms, page indexation status, and backlink growth. Skip vanity metrics like total impressions or keyword volume unless they directly connect to business outcome. The rule: every metric in your report should answer "Is our SEO strategy working?" If it doesn't, remove it. A three-metric report trusted by your client beats a ten-metric dashboard they ignore.
What's the best tool to build custom SEO reports?
Choose based on your data sources and automation appetite. Looker Studio is free and best for Google-only clients. Whatagraph and DashThis are ideal for multi-source reporting and agency scaling. Jottler stands apart because it automates not just reporting but the entire content creation and keyword research pipeline, so your reports are grounded in real, audited SEO strategy. Your reporting system becomes an extension of your SEO execution, not a separate tool that lags behind your actual work.