Building Lead Scoring Workflows That Convert
Most B2B teams generate leads but squander them. Marketing pumps MQLs into the funnel while sales complains about quality. The problem isn't volumeit's visibility. Companies using lead scoring report 138% ROI on lead generation versus 78% for teams without it, yet 79% of B2B leads never convert due to poor nurturing. The gap? Most organizations lack structured workflows that connect lead quality assessment to immediate action. When behavioral and demographic signals are properly weighted and automated, conversion doesn't improve by small marginsit doubles. Here's how to build a lead scoring system that actually moves deals forward.
Key Takeaways
- 138% ROI uplift separates lead scoring adopters from teams relying on volume alone (Landbase, 2026)
- Machine-learning scoring delivers 75% higher conversion rates than manual point systems
- Top-quartile B2B teams convert 28% of MQLs to SQLs; median teams convert 13%the gap is workflow architecture, not effort
- Dual-Signal Scoring Model: Combining behavioral intent with demographic fit creates 3x more accurate lead qualification than either signal alone.
- Predictive Machine Learning: AI models adapt automatically to conversion patterns, delivering consistent improvements without manual tweaking.
- Real-Time Workflow Automation: Trigger-based sequences eliminate lead leakage by nurturing high-intent prospects instantly.
- Progressive Profiling: Collecting data in stages across multiple touchpoints builds complete ICPs without friction.
- Continuous Model Optimization: Weekly funnel reviews and sales feedback loops tighten scoring accuracy over time.
Why Lead Scoring Fails and How to Fix It
Most lead scoring breakdowns happen before a single point is assigned. Teams build rigid systems on guesswork: "Managers are worth 50 points. Website visits are worth 2 points each." Then they wonder why leads marked "hot" close nothing and qualified leads go ignored. The real culprit is disconnectionscoring systems that exist in isolation, detached from actual revenue data and sales feedback. Top quartile teams reject roughly 30% of MQLs at the scoring layer before SDR touch, using it as a quality filter, not just a prioritization tool. Average teams treat scoring as output theater; elite teams treat it as the conversion lever.
The Three Common Mistakes That Tank Scoring Models
First, relying on demographics alone. A VP of Marketing at a 300-person SaaS company isn't automatically sales-ready just because the title fits. Fit without intent is noise. Second, ignoring time decay. A lead who engaged heavily six months ago decays to nearly worthless, but most systems keep them scored as-is. Third, poor alignment between sales and marketing. Marketing defines an MQL one way; sales expects something entirely different. When handoff criteria aren't shared and agreed, qualified leads feel rejected and unqualified leads waste sales time. These three errors compound: poor signals, stale data, and misaligned definitions create distrust.
The fix isn't a better point systemit's a workflow architecture that combines three layers: first, a dual-signal scoring model that weighs both behavior and fit; second, real-time automation that acts on high-intent signals immediately; and third, continuous feedback loops that prove the model works. When your content marketing automation strategy fuels consistent lead generation, scoring workflows become the difference between compound growth and wasted spend.
Why Predictive Scoring Outperforms Manual Systems
Predictive models using machine learning are associated with 75% higher conversion rates compared with traditional manual scoring. The reason is pattern recognition at scale. A predictive model trained on your won and lost deal history learns which combinations of attributesindustry, engagement velocity, content consumed, pricing page visits, demo requestscorrelate with close probability. It doesn't just weight individual signals; it discovers interactions. A sales director from a logistics company who visits the pricing page after downloading a case study might have high predicted close probability, while a CEO from the same industry who passively attended a webinar might be low probability. Manual systems can't capture these interactions; ML models find them automatically.
Implementation requires two prerequisites: sufficient historical data (usually 50-100+ closed deals) and a platform that supports model training. Landbase's 2026 data documents that organizations deploying predictive scoring achieve 300–400% first-year ROI in many cases, because sales team velocity improves so dramatically. They stop chasing dead ends and focus on leads with high conversion probability.
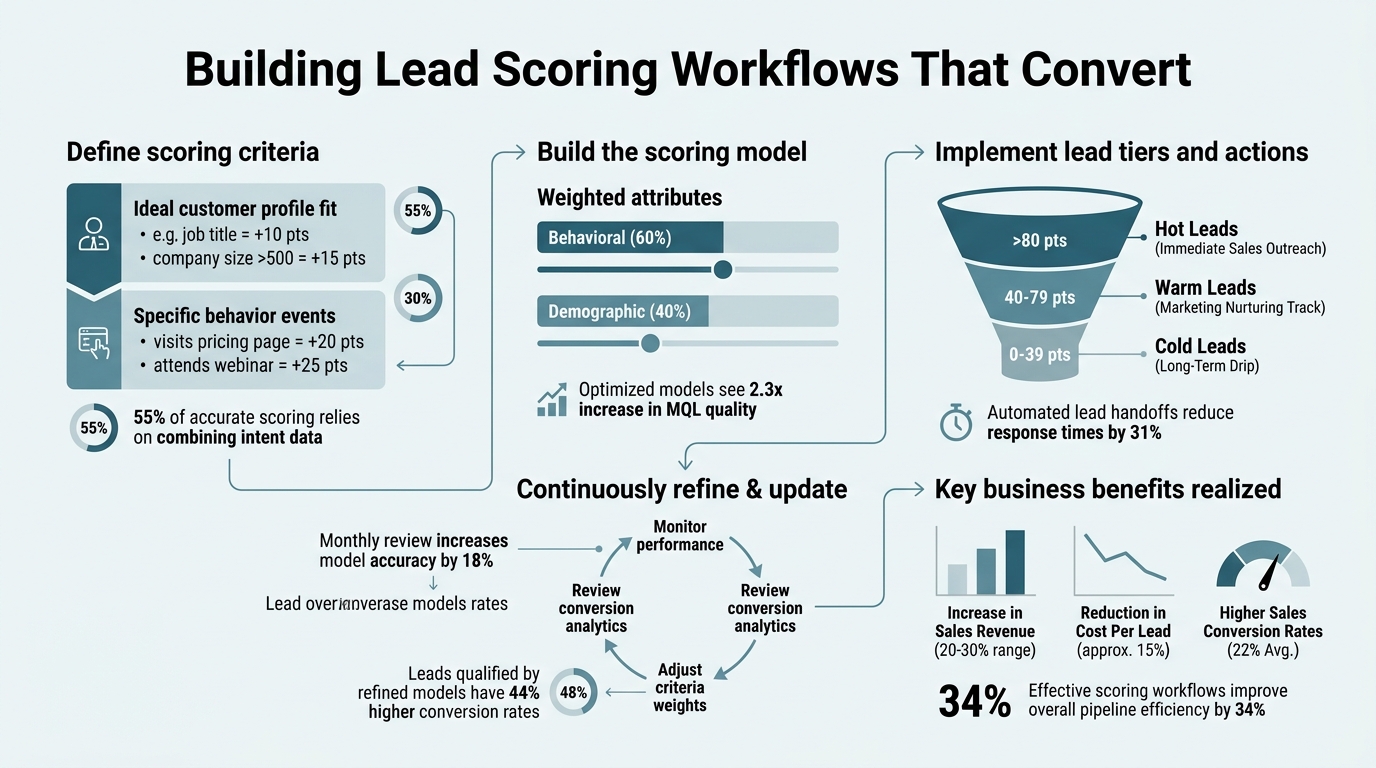
How to Build a Dual-Signal Lead Scoring Framework
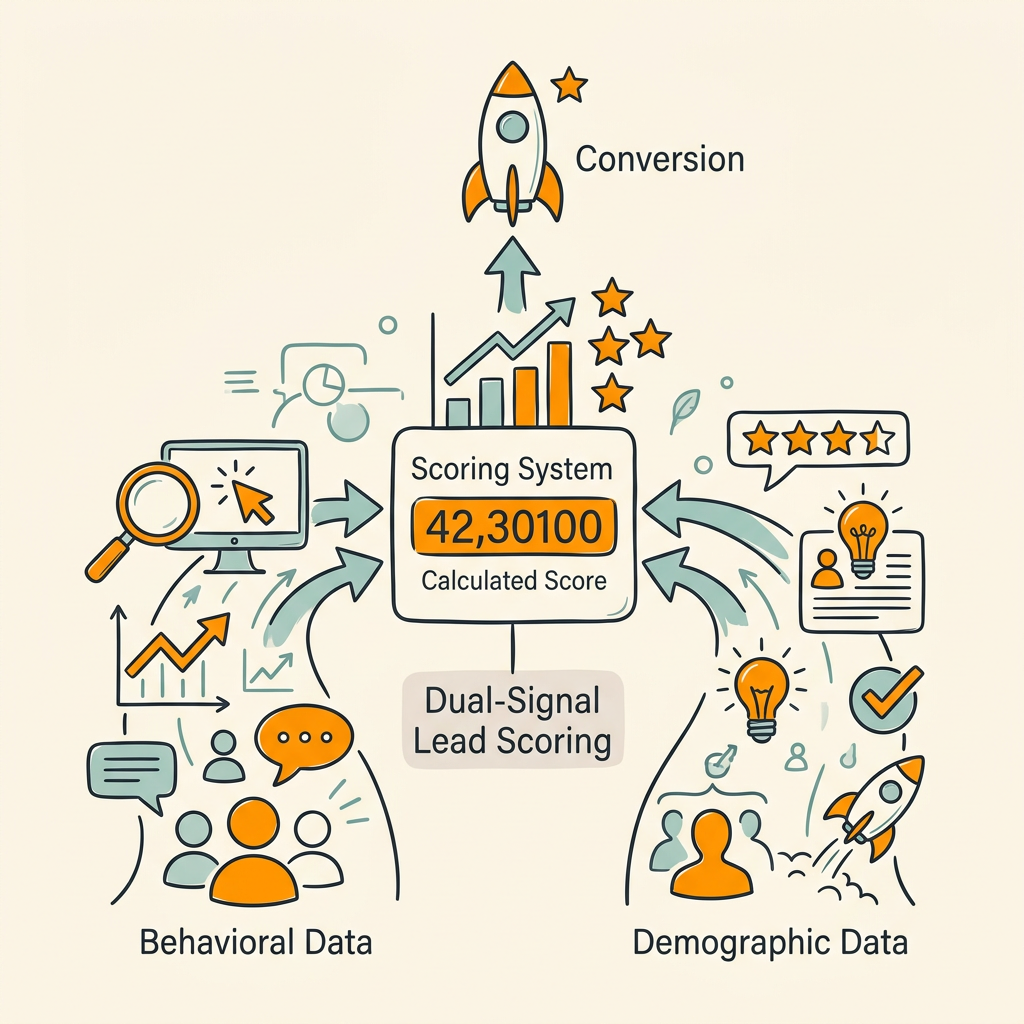
Effective lead scoring in 2026 combines two independent signals into a single decision engine. Behavioral scoring captures intentwhat the lead is doing right now. Fit scoring assesses likelihood to buywho they are, where they work, what they need. Together, these signals predict conversion with far greater accuracy than either alone. The key is building them separately, then weaving them into a unified workflow.
Behavioral Scoring: Intent Through Action
Behavioral scoring answers: "How interested is this lead, right now?" It's built from first-party signals your marketing automation platform tracks. Every meaningful action signals growing purchase intent, and those signals accumulate into a behavior score. Start by identifying which actions correlate with closed wins. For most B2B SaaS, the strongest signals include website visits (especially to pricing pages), email engagement (opens, clicks), content downloads (especially high-intent content like case studies and ROI calculators), demo requests, and sales collateral views. Digital Applied's lead scoring workflow guide documents that demo requests and pricing page visits predict SQL conversion 8-12x better than generic web visits.
Point assignment is straightforward but requires data discipline. Assign points based on historical conversion correlation, not guesswork:
- High-intent actions (20-30 points): Demo request, pricing page visit, free trial signup, sales asset download
- Medium-intent actions (5-10 points): Email opens (multiple), content download, webinar attendance, case study view
- Low-intent actions (1-3 points): Website visit, blog read, whitepaper download, newsletter signup
Critically, add decay rules. Set a time window (usually 30-90 days) where points stay active. After that window, reduce points by 25-50% each week. A lead that engaged heavily 120 days ago shouldn't score the same as one that engaged yesterday. This prevents SDRs from chasing cold, stale leads that feel hot on paper.
Fit Scoring: Demographic and Firmographic Alignment
Fit scoring answers: "Is this lead's company and role a match for our ideal customer profile (ICP)?" It's built from company attributes (industry, size, revenue, tech stack) and lead attributes (role, seniority, department). Unlike behavioral scoring, fit scores change slowly and inform whether to pursue a lead at all.
Start by mapping your ICP to scoring criteria. If your target market is mid-market SaaS companies (100–500 employees) in the marketing tech space, those companies get high fit scores. A solopreneur in an unrelated industry gets a low fit scoreno amount of behavioral engagement can overcome poor fit. Fit signals typically include:
- Industry alignment: +15 points for target industries; -10 for out-of-market
- Company size: +20 points if 100–1000 employees; scale down outside that range
- Role seniority: +15 points for director+ roles; +8 for manager roles; +0 for ICs
- Department fit: +10 points if from marketing/sales/RevOps; lower for other departments
- Budget relevance: +25 points if company has recent funding or hiring in target function
Use lead enrichment platforms to populate company attributes automatically. Equanax's SaaS lead generation research recommends verifying all inbound data with at least one enrichment system to eliminate bad data at the entry point. Without verified firmographics, fit scoring is built on sand.
Combined Scoring: The Qualification Matrix
The magic happens when you overlay behavioral and fit scores into a qualification matrix. A lead with high behavioral score but low fit score might get nurtured longer before sales touch (marketing follow-up). A lead with moderate behavior but high fit gets escalated immediately (high-potential account, just needs nudge). A lead with low scores on both gets put into evergreen nurture sequences, not sales queues.
| Behavioral Score | Fit Score | Action | Ownership |
|---|---|---|---|
| High (70+) | High (70+) | Pass to sales immediately (SQL) | Sales Development |
| High (70+) | Medium (40-69) | Extended nurturing + sales outreach | Marketing + Sales |
| Medium (40-69) | High (70+) | Sales outreach with longer cycle | Sales Development |
| Medium (40-69) | Medium (40-69) | Nurturing via trigger sequences | Marketing Automation |
| Low (<40) | Any | Evergreen nurture, re-engagement | Email nurture |
This approach eliminates the "hot lead goes cold" problem because routing is explicit and tied to both signals. A prospect who visited your pricing page (high behavior) but works at a company outside your ICP (low fit) doesn't clog sales queues; they flow into a nurture track designed to educate them for future readiness. Understanding these workflows is foundational to scaling B2B content strategy that attracts and converts the right buyers.
Automating Lead Scoring Workflows for Real-Time Action
Scoring without automation is insight theater. You know which leads are hot, but they go cold while you manually load them into CRM. The speed-to-lead problem is severe: responding within 60 seconds of lead generation can improve conversions by up to 391%. Real-time workflow automation triggers nurture sequences and sales notifications the moment a lead hits a scoring threshold, eliminating the delay that kills conversion.
Building Trigger-Based Automation Sequences
Trigger-based workflows activate automatically when a lead reaches a specific score or performs a specific action. The setup depends on your marketing automation platform (HubSpot, Marketo, Klaviyo) and CRM, but the structure is universal. Define a trigger event (e.g., behavioral score > 70), then define the action (e.g., send SMS notification to SDR, enroll in high-intent nurture sequence, create task in Salesforce).
Most effective trigger workflows include:
- Demo request trigger: When a lead submits a demo request, immediately notify the SDR and enroll in a 5-email nurture sequence over 2 weeks reinforcing next steps
- Pricing page trigger: When a lead visits pricing after downloading a case study, send a targeted discount or ROI calculator via SMS within 2 minutes
- Engagement spike trigger: When a lead goes from passive (1-2 touches) to engaged (5+ touches in 7 days), escalate behavior score by 20 points and flag for sales review
- Score decay trigger: Every 7 days, reduce points on leads that haven't engaged in 30 days, automatically moving them out of the "hot" category
The automation prevents SDRs from constantly monitoring dashboards. Instead, they get notified only when a lead reaches a readiness threshold, letting them focus on closing versus chasing.
Progressive Profiling: Building Complete Lead Records Without Form Friction
Traditional lead capture forms ask 8-15 fields up front, creating friction and drop-off. Progressive profiling spreads data collection across multiple form submissions, building a complete picture over time without overwhelming the prospect. First form: email. Second form: company name. Third form: job title and department. By the time the lead reaches sales, you have all the data needed for fit scoring, and they've never felt bombarded.
This approach combined with behavioral tracking often reveals more intent than a single monolithic form. A prospect who returns to your site three times and fills progressive forms on each visit signals consistent interest, whereas one who fills a long form once might be casually exploring. The workflow automatically adjusts scores based on progressive profiling depth: as you collect more data, fit scoring becomes more precise.
Micro-Personalization at Scale
Once scoring separates leads into tiers, trigger different nurture experiences. A high-fit, high-behavior lead gets different emails, different assets, and different timing than a medium-fit lead. A project-management SaaS improved SQL conversions by 23% after implementing micro-personalized sequences based on firmographic industry tags (Equanax, 2026). This is simple to set up: in HubSpot or Marketo, create two or three nurture tracks (one per buyer persona or segment), then route leads into the appropriate track based on their industry, role, and company size.
The result: every lead receives messaging tailored to their context, not generic company boilerplate. Nurture becomes a conversion engine, not a time-killer.
Scoring Models: Point-Based vs. Predictive Approaches
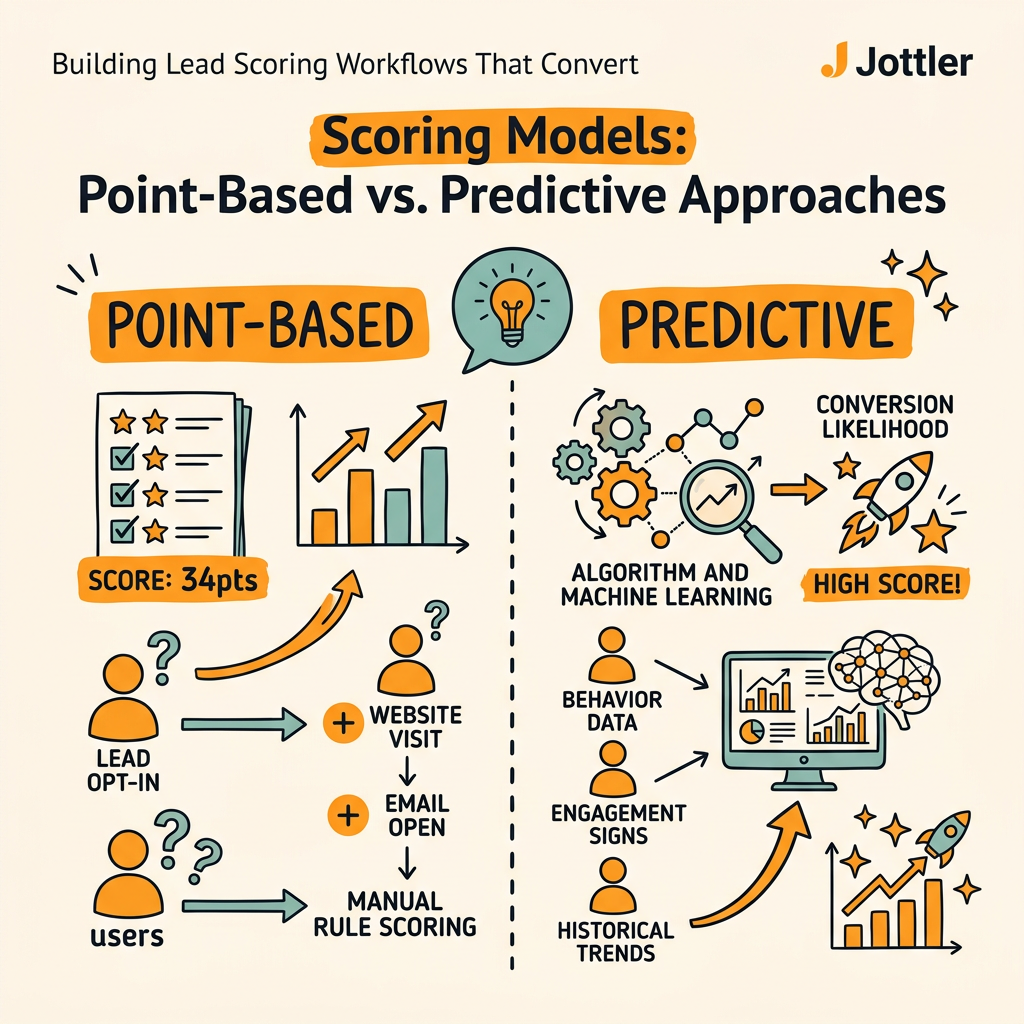
Two scoring architectures dominate modern B2B: point-based systems and machine-learning predictive models. Each has distinct tradeoffs. Understanding when to use each ensures your workflow matches your data maturity and team bandwidth.
Point-Based Scoring: Transparency and Control
Point-based scoring is rules-driven: assign fixed points to actions and attributes, accumulate them, set thresholds. A lead who downloads a case study (10 points) and attends a webinar (5 points) and opens an email (2 points) accumulates 17 points. At 70 points, they become SQL.
Advantages: transparency (anyone can audit why a lead is scored), ease of setup (no data scientists required), and direct control (you decide what's valuable). Disadvantages: static (you must manually update rules as markets shift), labor-intensive (requires regular review), and often inaccurate (assumptions you make about point values are rarely validated against actual conversions).
Point-based scoring works best for teams handling up to ~5,000 MQLs per month who have good sales-marketing alignment and can commit to weekly model reviews. It's also the right starting point if you lack sufficient historical conversion data (under 50 closed deals).
Predictive Scoring: AI-Driven Accuracy Without Manual Overhead
Predictive models train on historical deal databoth won and lostto learn which combinations of attributes predict close probability. The model automatically weights signals based on actual correlation to revenue, not guesswork. As new data arrives, the model retrains and adapts.
Advantages: accuracy (models often outperform manual scoring by 25-40%), automation (no weekly tweaking required), and adaptability (models improve as market behavior changes). Disadvantages: data requirement (you need 50-100+ closed deals to train accurately), platform dependency (not all CRMs offer native predictive scoring), and initial opacity (it's harder to explain why lead X got scored 68 when the model learned on thousands of parameters).
Predictive scoring is essential if you're handling 5,000+ MQLs monthly and want to improve MQL-to-SQL conversion. Organizations with behavioral lead scoring see measurable improvements in demo booking rates and post-demo progression, but AI models compound those gains by identifying non-obvious patterns. Salesforce's Einstein, HubSpot's AI predictive lead scoring (Enterprise tier), and specialist tools like 6sense or Onfire all support this approach.
Hybrid Approach: Combining Manual and Machine Learning
Leading teams use a hybrid model: run point-based scoring as your primary system for simplicity and alignment, but run a parallel predictive model for validation and learning. Track which leads the predictive model scores higher than your manual model, then investigate why. Did they close? Did they convert to SQL faster? This feedback loop lets you incrementally improve your manual system by learning from the predictive model's accuracy.
The best implementation: start with point-based scoring, implement progressive profiling and trigger automation around it, run for 8-12 weeks collecting performance data, then introduce a predictive model running in parallel. Once the predictive model proves itself more accurate, migrate your primary routing to it while keeping the manual system as a secondary check.
Aligning Sales and Marketing Around Shared Definitions
The most sophisticated scoring system fails if sales and marketing disagree on what a qualified lead looks like. Marketing celebrates MQLs; sales complains they're unqualified. The misalignment tanks the entire funnel. Elite teams prevent this by building scoring in collaboration between both functions, with explicit handoff criteria and regular feedback loops. When your SaaS SEO strategy consistently delivers targeted organic leads, alignment becomes even more criticalyour sales and marketing teams must agree on what "qualified" means so nothing falls through the cracks.
Co-Defining MQL and SQL Thresholds
Schedule a joint workshop with marketing leadership, sales leadership, and RevOps. Map the customer journey together: where does a lead enter, what signals indicate progression, what thresholds mean the lead is sales-ready? Document the MQL definition explicitly: "An MQL is a lead with a fit score above 50 and a behavioral score above 40, or a lead with a fit score above 60 and any behavioral score, or a lead who submits a demo request regardless of other scores."
Make SQL criteria equally explicit. Most teams define SQL as: "A lead that has been qualified by sales, typically after an initial conversation or discovery call." But shared scoring definitions mean: "A lead with fit score > 70 and behavioral score > 70, passed to sales with a lead qualification task, and marked SQL only after sales confirms fit."
This clarity prevents the "great lead, bad timing" excuse and creates mutual accountability. Marketing owns lead volume and quality through segment targeting. Sales owns follow-up speed and qualification discipline. When leads are defined upfront, both teams have clarity on what they're responsible for.
Establishing Feedback Loops and Model Reviews
After 4 weeks of routing leads via your scoring model, run a retrospective. Pull reports: How many MQLs passed to sales? How many converted to SQL? What's your MQL-to-SQL conversion rate? Which lead sources produce the highest-converting MQLs? Which behaviors drove the most conversions?
Then ask sales directly: Did the leads feel qualified? Were they ready to buy or early-stage explorers? Did any high-scoring leads feel like misses? Conversely, did any low-scoring leads surprise you with close probability? Collect this feedbackit becomes your input for the next model iteration.
Top quartile teams reject roughly 30% of MQLs at the scoring layer before SDR touch, using scoring as a quality gate. They do this because they've calibrated their model through repeated feedback loops. Establish a cadence: weekly metric reviews with marketing ops, biweekly joint review with sales, monthly deep-dive on model accuracy.
Building Shared Visibility Through RevOps Dashboards
Neither team trusts what they can't see. Create a shared dashboard showing: leads by score bucket, MQL-to-SQL conversion by source, average days to SQL, average deal size for leads from each score range, and SDR acceptance rate (what % of passed leads do SDRs accept). This single source of truth eliminates the "marketing sends bad leads" versus "sales isn't following up" blame game.
When both teams see that high-score leads convert at 35% and low-score leads convert at 2%, they understand why scoring matters. When they see that SDRs convert leads marked SQL within 48 hours 80% of the time, they trust the handoff. Visibility builds alignment faster than any meeting.
Implementing Progressive Profiling and Behavioral Tracking
Complete lead profiles are built in layers, not captured in a single form. Progressive profiling spreads data collection across multiple touchpoints, reducing form friction while building depth. Combined with behavioral tracking, it creates rich qualification signals without overwhelming prospects.
Multi-Stage Form Strategy
Design your forms around a progression:
- First form (blog CTA, early-stage asset): Email only. You want maximum conversion.
- Second form (mid-stage asset like case study): Email + Company name. You're qualifying firmographic fit.
- Third form (high-intent asset like ROI calculator): Email + Company + Title + Department + Budget. You're confirming the lead is in a buying scenario.
- Fourth form (demo request): All previous fields plus decision timeline. You're confirming urgency.
Each form reduces friction compared to a single 8-field form (which converts 30-50% lower). A prospect willing to fill a third form has higher intent than one captured in a first form. Behavioral scoring naturally reflects this: completing multiple forms compounds their engagement score.
Behavioral Data Integration Across Touchpoints
Modern marketing automation platforms track behavior across email, web, and forms. Ensure your setup captures:
- Email behaviors: Opens, clicks, unsubscribes (important: unsubscribe lowers score)
- Web behaviors: Page visits, time on site, scroll depth, video watches, document downloads
- Form completions: Which fields they've filled, how many times they've submitted, progressive profiling depth
- Custom events: API calls to track external actions (e.g., Slack signup, feature usage if they're a free trial user)
All of this feeds your behavioral score in real time. As leads engage more, their behavior score rises. Triggers fire automatically: "Behavior score crossed 60, enroll in high-intent nurture sequence."
Enrichment: Filling Firmographic Gaps Automatically
Behavioral data tells you what a lead is doing; enrichment data tells you who they are. When a new lead enters your system, pass them to an enrichment API (Apollo, ZoomInfo, Clearbit) to populate company attributes automatically: industry, headcount, revenue, funding, tech stack. This happens in the background, so the lead form stays short while you get complete data for fit scoring.
The downside: enrichment APIs cost money and aren't always 100% accurate. The upside: you eliminate the manual research SDRs would do. You also catch mismatches early: if enrichment returns that a "VP at Marketing Tech Co" actually works for a 10-person agency, you know fit is low despite the fancy title.
Continuous Optimization: Making Your Model Better Weekly
Scoring models are never "done." Markets shift, products evolve, customer behavior changes. The best workflows include continuous optimization loops that tighten accuracy week after week, compounding your conversion improvements. This is why having autonomous SEO systems feeding your top-of-funnel mattersconsistent, targeted content attracts more leads that you can score, profile, and optimize against continuously.
Weekly Metric Reviews and Diagnostics
Run a simple weekly report: How many leads were scored? What's the MQL volume this week? MQL-to-SQL conversion rate? Average behavior and fit scores of SQLs versus rejected leads? Are any segments (by source, industry, persona) over- or under-performing?
Look for anomalies. If leads from paid search have lower SQL conversion than organic, investigate: are you targeting the wrong keywords, or is the form attracting the wrong personas? If a particular behavior (e.g., content downloads) isn't correlating with SQL conversion, maybe it's not as predictive as you thoughtlower its point value.
This weekly cadence prevents minor drift from becoming major misalignment. Problems surface in days, not months.
Sales Feedback Mechanisms for Model Validation
After every sales call, SDRs should log a simple feedback field: "Lead quality: High / Medium / Low" and optionally, "Why?" This qualitative feedback validates your quantitative scores. If a lead scores 75 (SQL threshold) but the SDR marks quality as "Lowlead not looking to buy for 18 months," that's a signal your model is over-weighting exploratory behaviors and under-weighting buying-window signals.
Aggregate this monthly: "This month, 92% of leads marked SQL had medium-to-high quality feedback. 8% marked low quality. Of the low-quality leads, 5 cited 'exploration only, no timeline,' suggesting we should add timeline intent to our model."
This closes the loop: insights from sales improve marketing's model, which improves the lead quality sales receives, which reinforces the feedback. Each cycle tightens the system.
Seasonal and Product-Specific Scoring Adjustments
Your ICP might change with seasons, product launches, or market shifts. When you launch a new product module, buying criteria changedifferent personas become valuable. Adjust your fit scoring to reflect the new target. When you enter a new vertical, geographic market, or build a new partnership, revisit firmographic scoring.
This doesn't require a complete model rebuildit's lightweight adjustments that keep scoring aligned with your actual go-to-market strategy. Every quarter, ask: "Has our ICP changed? Should any fit scores be adjusted? Are any behavioral signals no longer predictive?" Make those tweaks, track the impact, and iterate.
Conclusion
Lead scoring workflows separate companies doubling conversion rates from those cycling through expensive, low-ROI campaigns. The architecture is simple: combine behavioral and fit signals into dual scoring dimensions, automate trigger-based workflows that act on high-intent signals instantly, and establish feedback loops that tighten accuracy weekly. Companies using lead scoring report 138% ROI uplift, while top-quartile teams convert 28% of MQLs to SQLsdouble the median. Machine-learning models deliver 75% higher conversion rates compared with traditional manual scoring, yet require only 8-12 weeks of data to train.
The best workflows aren't theoretical exercises in point assignmentsthey're operational systems that close loops between marketing signal, sales action, and revenue outcome. Start with shared definitions between sales and marketing. Build behavioral and fit scoring in parallel. Implement progressive profiling to reduce form friction while building complete lead records. Automate trigger-based nurture. Then measure weekly, collect sales feedback, and iterate. Within 90 days, you'll see measurable improvements in MQL quality, SQL conversion, and deal velocity.
Start your SEO agent with Jottler to automate the research, writing, and internal linking needed to attract high-intent leads at scale. Consistent, SEO-optimized content compounds your organic lead pipeline while your lead scoring workflows convert them into revenue.
FAQs
What is the difference between lead scoring and lead qualification?
Lead scoring is automated, assigning points based on predetermined criteria. A lead's behavioral score rises when they download a case study or visit pricing. Qualification, by contrast, is manual and conversationala sales rep talks to the lead and confirms fit. Scoring predicts readiness; qualification confirms it. In modern workflows, scoring routes leads to sales for qualification. A high-scoring lead still gets qualified by an SDR because scoring is probabilistic, not perfect. Qualification is the human checkpoint that converts scoring insight into committed action.
How long does it take to build and optimize a lead scoring model?
Initial model setup takes 2-4 weeks if you start with point-based scoring (defining behavioral signals, fit attributes, and thresholds collaboratively). After launch, the real work begins: weekly metric reviews and monthly model adjustments based on sales feedback. Predictive models require 8-12 weeks of transaction data to train accurately, then another 4-8 weeks of parallel testing before full deployment. Full optimizationwhere your model is tight, feedback loops are embedded, and SDR acceptance rates exceed 85%typically takes 3-6 months of disciplined iteration.
What happens if a lead has a high score but low conversion probability?
This reveals gaps in your model. A high-scoring lead that doesn't convert suggests your behavioral signals are capturing activity (lots of engagement) without capturing intent (actual buying need). Common causes: form fields that aren't validating firmographic fit, behavioral points that reward engagement without intent (e.g., downloading educational content from researchers), or time-window issues (scoring old leads the same as fresh leads). The fix: investigate the pattern. If 20% of high-scoring leads don't convert, review their profiles for commonalities. Add disqualifying criteria (e.g., reduce score if company size is outside ICP, even if behavior is high). Use sales feedback systematically to surface these patterns before they become systemic leaks.