Measuring SEO Success: Key Metrics Beyond Rankings
Rankings matter less than you think. 49% of marketers identify organic search as the top ROI-driving digital channel, yet most teams are still obsessed with SERP positions while ignoring the metrics that actually move revenue. The real problem? Traditional rankings dashboards hide what's working and what's draining your budget. You can rank on page one for a hundred keywords and still lose money if nobody converts. This guide reveals the metrics that separate profitable SEO programs from vanity-metric dead ends, and how to build a measurement system that connects organic traffic directly to business outcomes.
Key Takeaways
- 49% of marketers now prioritize organic search as their highest ROI channel, shifting focus from rankings to revenue (2026, Industry Data).
- Average organic conversion rate is 2.4%, but top-performing pages in competitive industries reach 7%+ when tracked by intent and landing page.
- Well-executed SEO campaigns deliver median ROI of ~748%, with some sectors reporting 900%–1,100%+ when revenue is properly attributed.
- Organic Conversion Rate: The single best proxy for SEO profitability—segment by landing page and intent for actionable insights.
- Organic-Sourced Revenue: Connect GA4 to your CRM to measure actual pipeline value and closed-won deals from organic traffic.
- Click-Through Rate (CTR) by Topic: Track how compelling your titles and snippets are; a 27.6% CTR at rank #1 is the baseline.
- Non-Branded Traffic Share: Raw traffic growth can hide declining demand capture if branded traffic inflates the numbers.
- Assisted Revenue and Multi-Touch Attribution: Organic search often appears earlier in the funnel—measure its real influence on closed deals.
- Core Web Vitals and Indexation Health: Technical KPIs enable scaling; poor health directly suppresses visibility and conversions.
Why Rankings Alone Fail to Measure SEO Success
Ranking position creates a false sense of progress. You can achieve top-10 rankings for dozens of keywords and still generate zero conversions if those keywords don't match user intent or if your landing pages fail to persuade. Only 0.63% of Google users click to page two, which is why position matters—but only as a leading indicator. The fatal flaw in rank-only measurement is that it ignores the quality of traffic: whether visitors are qualified, whether they engage with your content, and whether they convert. Most teams spend months optimizing for keywords their ideal customers never actually search for, then wonder why the traffic doesn't convert.
"You can rank on page one for a hundred keywords and still lose money if those keywords don't match user intent. Rankings alone mask the real cost of underperforming keywords and wasted optimization effort." — Modern SEO Practice
Ranking also obscures the true cost of SEO. If you're paying $5,000 per month on content creation and tools to rank for a keyword that brings 100 visitors per month at a 0% conversion rate, your "success" is costing you $50 per visitor with zero return. This is the ranking trap: high positions with low ROI.
The shift in 2026 is decisive. Forward-thinking teams are moving from "How many keywords rank?" to "What revenue did organic search generate?" The difference is not semantic—it's the difference between sustaining a content program and crushing quarterly revenue targets.
How to Define and Track Organic Conversion Rate
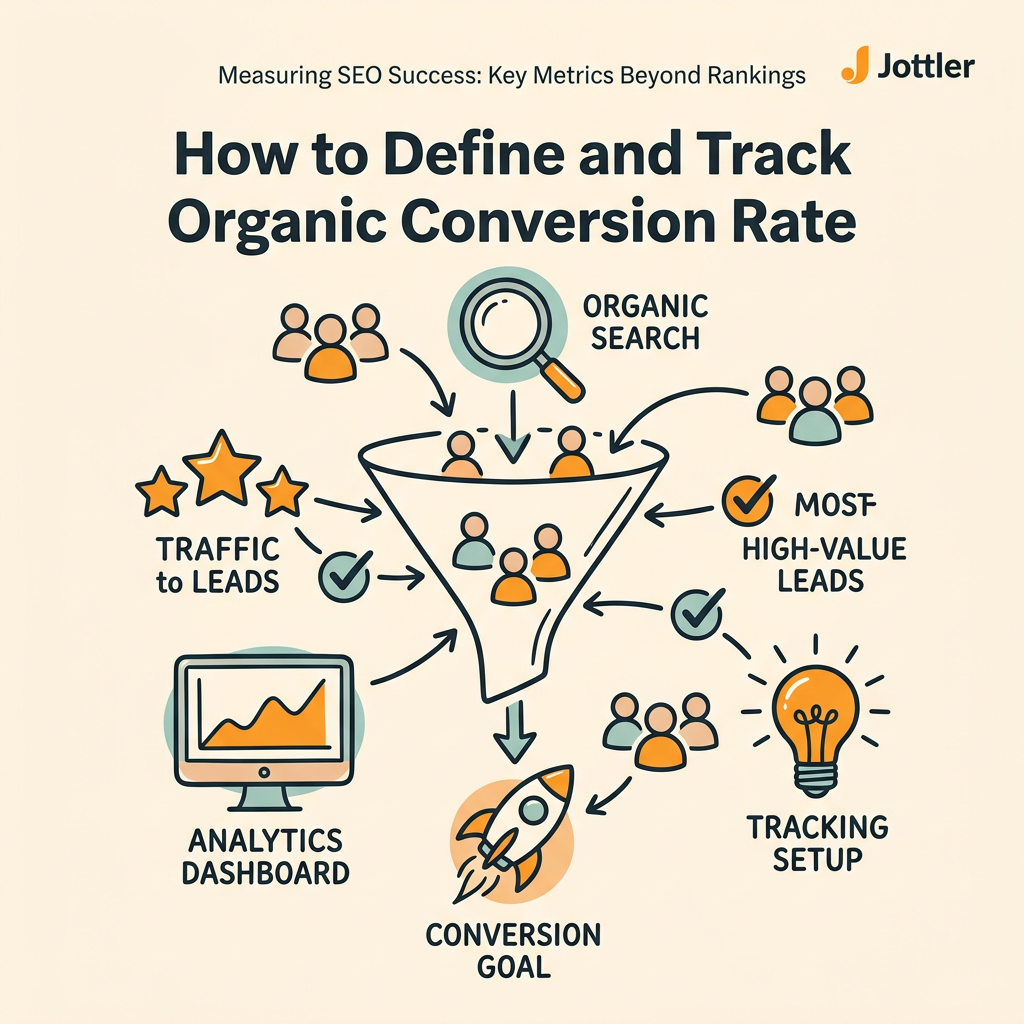
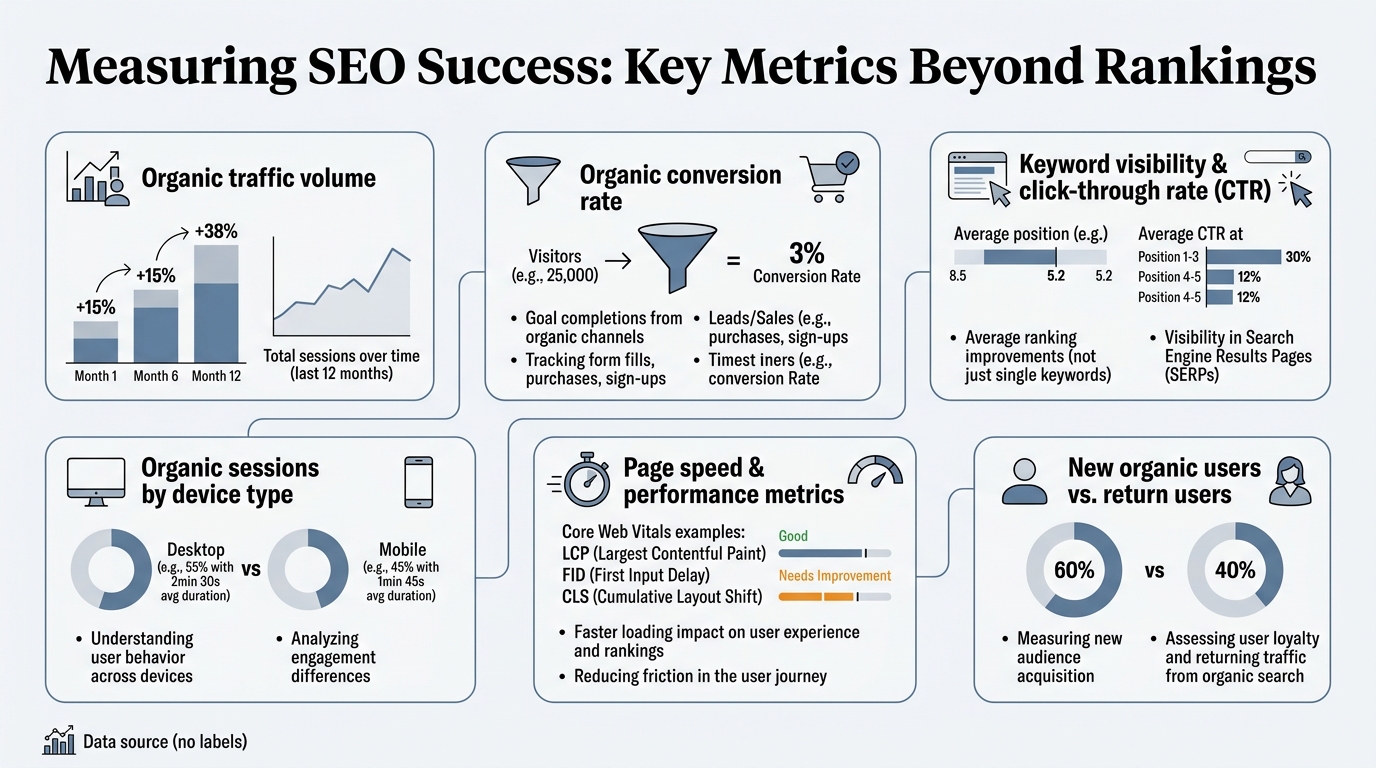
Conversion rate is the single most important metric beyond rankings. It measures what percentage of your organic visitors take an action that matters: a purchase, a demo request, a lead form submission, or an add-to-cart. According to recent SEO ROI data, the industry average is 2.4% across all verticals, but this number varies dramatically by industry, intent, and page type. Legal services achieve 7%+, while high-funnel educational content often sits below 1%. The insight is that context matters—your baseline should be your own historical data and your closest competitors, not industry averages.
To measure organic conversion rate correctly:
- Define what counts as a conversion. Align with your sales and product teams on which actions matter. For B2B SaaS, that's usually a qualified lead form, a trial signup, or a demo request. For ecommerce, it's a purchase or add-to-cart. Micro-conversions like email signups or downloads are useful for measuring engagement but shouldn't be your primary metric.
- Filter GA4 (or your analytics tool) to organic traffic only. Create a segment that includes only sessions from "Organic Search." Exclude branded traffic if you're trying to understand true demand capture—branded visitors are already familiar with your brand and convert at a much higher rate than non-branded, so blending them obscures your true non-branded conversion performance.
- Calculate the rate by landing page and content type. Don't report a single sitewide conversion rate. Instead, segment by blog post, product page, comparison guide, and resource download. Your "Best X Tools" article will convert differently than a homepage or a demo page, and seeing these breakdowns reveals which content types actually generate qualified traffic.
- Track conversion rate trends monthly and benchmark against benchmarks like 2.4% or your own historical average. A rising conversion rate paired with stable or rising traffic is the clearest sign that your SEO program is healthier. A falling conversion rate despite rising traffic signals that you're attracting lower-quality visitors—possibly because you're ranking for low-intent keywords.
Measuring Revenue and Attribution from Organic Search
Revenue is the metric that matters to your CFO. But organic search rarely generates immediate revenue—it's often part of a multi-touch customer journey where the visitor returns days or weeks later, perhaps through a different channel, before converting. Measuring organic revenue requires connecting your analytics tool to your CRM and using multi-touch attribution.
"SEO leads close at a 14.6% rate versus 1.7% for outbound marketing leads—making organic search one of the highest-quality lead sources available. This quality difference is why organic traffic often generates higher lifetime value and lower customer acquisition cost than paid channels." — SEO Lead Quality Research
The standard approach is to measure organic-sourced pipeline value: the total dollar value of opportunities and deals that can be traced back to an organic landing page. SEO leads close at a 14.6% rate versus 1.7% for outbound marketing leads, making organic search one of the highest-quality lead sources available. This quality difference is why organic traffic often generates higher lifetime value and lower CAC than paid channels. Benchmark your organic CAC against your paid channel costs and you'll see why leading SEO teams prioritize organic ROI measurement as the primary success indicator.
To implement revenue attribution:
- Connect GA4 to your CRM (HubSpot, Salesforce, Pipedrive, etc.). Use UTM parameters or CRM integrations to tag organic sessions and track which ones lead to opportunities and closed-won deals.
- Measure both last-click and assisted conversions. Last-click gives all credit to the final touchpoint before conversion; assisted shows how many deals had an organic touchpoint somewhere in the journey. Assisted is often 2–3x higher because organic search frequently appears early, helping the prospect research the problem before they're ready to buy.
- Calculate organic revenue per session. Divide total organic revenue by total organic sessions for a clear efficiency metric. This is especially useful for ecommerce but works for B2B too. If your organic revenue per session is $12 and your traffic is growing 20% per month, you can forecast revenue impact directly.
- Compare organic CAC against paid and other channels. Divide total SEO investment (salaries, tools, content, agencies) by the number of customers acquired from organic search. Then compare to your CAC from Google Ads, LinkedIn, or email. Organic often wins by 2–5x, which is the strongest case for sustained SEO investment.
Click-Through Rate and SERP Visibility as Leading Indicators
CTR measures how compelling your search results look to users. The #1 organic ranking averages 27.6% CTR, while positions 2–3 drop to around 10–15%. These numbers tell you that ranking position directly affects traffic, but CTR also reveals whether your title and meta description are resonating. If you rank #3 for a keyword but your CTR is half the industry average for that position, your snippet isn't competitive—you need to test new title tags or descriptions.
"A rising CTR while rankings stay flat signals that your titles and snippets are getting stronger. Conversely, a falling CTR despite stable rankings reveals that competitors' snippets are beating yours—indicating an immediate need to test and iterate on messaging." — Search Visibility Best Practice
Click-through rate is a leading indicator because it precedes conversions. A rising CTR signals that your titles and snippets are getting stronger, which will soon translate to more traffic and conversions. Conversely, a falling CTR while rankings stay flat suggests that competitors' snippets are beating yours—time to iterate.
To track CTR effectively:
- Pull CTR by landing page in Google Search Console. Filter by the page or by a URL prefix (like /blog/) to see how different content types perform.
- Benchmark against industry averages by ranking position. A typical top-3 result gets 10–20% CTR; legal services might see 15–25%. If your position-3 CTR is 5%, your snippet is underperforming and needs testing.
- Test title tag and meta description variations. A/B test 2–3 variations of your title and description for high-impression, low-CTR pages. Even small improvements (going from 5% to 8% CTR) generate 60% more traffic on the same rankings.
- Track branded versus non-branded CTR separately. Branded keywords almost always have higher CTR because people are looking for you specifically. Non-branded CTR is a better indicator of content competitiveness.
Organic Traffic Quality and Non-Branded Share
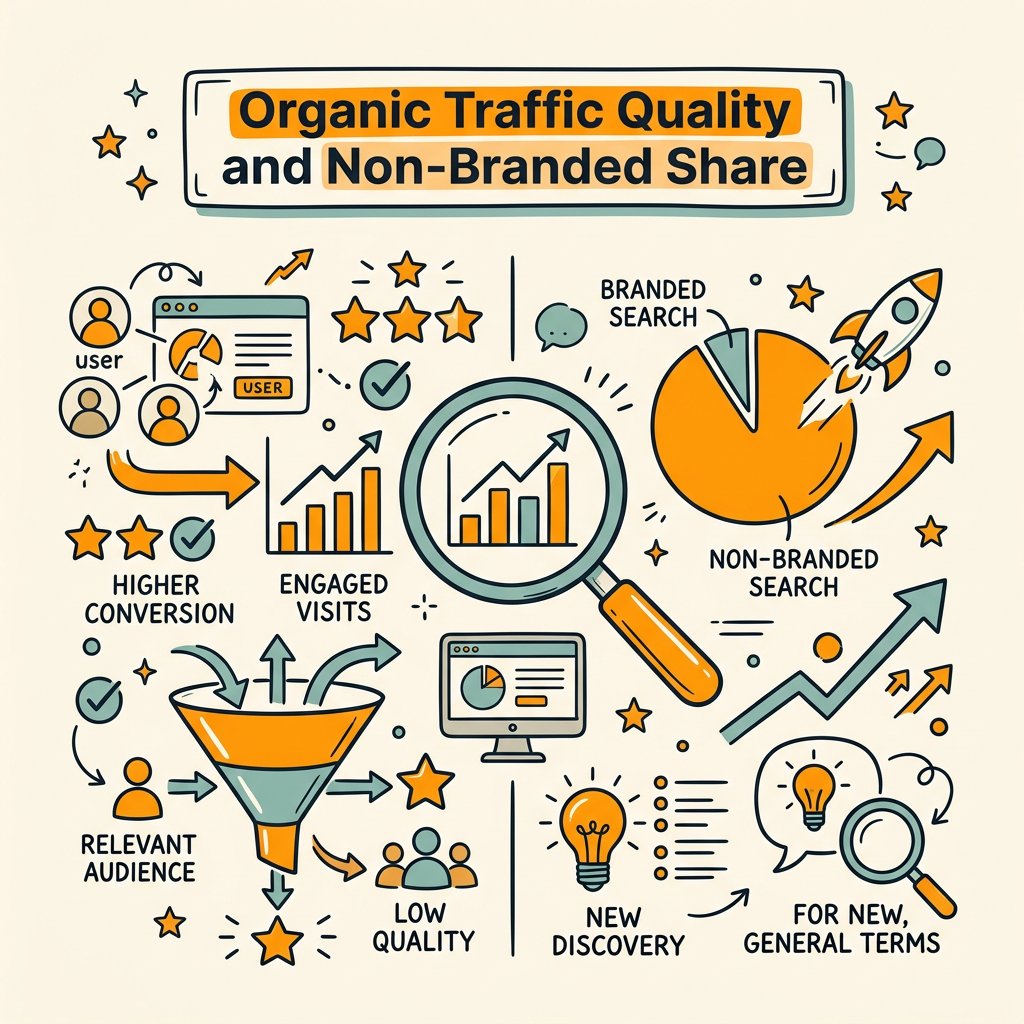
Raw organic session count is the most vanity of vanity metrics. Ten thousand sessions are worthless if 8,000 come from branded keywords (people already looking for you) and the remaining 2,000 don't convert. That's why separating branded from non-branded traffic reveals the truth: whether you're capturing new demand or just serving existing customers.
Non-branded traffic grows because your content is winning against competitors for searches that aren't about your brand. It's the metric that shows true demand capture and competitive advantage. If your non-branded traffic is flat while branded traffic grows 30%, you've made your existing customers happier but haven't expanded your market. Conversely, non-branded traffic growing 50% while branded stays flat is a signal that your content strategy is working and you're pulling in new audiences.
Quality also matters more than volume. 60% of marketers report that inbound strategies like SEO generate the highest-quality leads compared to outbound channels. This is partly because organic visitors are actively searching for solutions (high intent) versus being interrupted by ads. Measuring quality means tracking engagement time, pages per session, bounce rate, and—most importantly—conversion rate, all segmented by branded vs. non-branded. To understand how to scale organic traffic without burnout, focus on compounding non-branded demand over time through consistent content quality and topic authority.
Technical Health as an Enabling KPI
Core Web Vitals, indexation status, and crawl errors don't generate revenue on their own. But they're enabling metrics—they allow your content to rank and convert at its full potential. A site with poor Core Web Vitals loses visitors to competitors with faster pages. A site with crawl errors has unindexed content that never gets a chance to rank. A site with blocked resources can't be crawled efficiently, which limits how often Google discovers new pages.
Think of technical health as the foundation. You can have brilliant content and strong CTR, but if your page takes 5 seconds to load, you'll lose conversions to competitors whose pages load in 2 seconds. According to web performance research, each 100ms increase in page load time reduces conversion rate by approximately 1%.
Critical technical metrics to monitor:
- Core Web Vitals (Largest Contentful Paint, First Input Delay, Cumulative Layout Shift). Ensure your site hits the "Good" threshold set by Google. Monitor via Google Search Console or PageSpeed Insights monthly.
- Indexation status. Check Google Search Console monthly to ensure new content is being indexed within 48 hours of publication. A rising ratio of unindexed pages signals crawl budget issues.
- Crawl error count. Zero in on server errors (5xx) and not-found errors (404) that are preventing crawl. These should be addressed within days, not weeks.
- Mobile usability. With 60%+ of traffic from mobile, ensure your site is mobile-friendly. Test in mobile-first indexing context, not desktop.
Building a Measurement System That Competes With Ranking Dashboards
Most teams use ranking dashboards because they're simple: plug in 50 keywords, see their positions, done. But a single ranking dashboard has never closed a deal or generated a revenue milestone. The measurement system that moves needles integrates visibility (rankings, CTR, impressions), traffic (sessions, landing pages, engagement), conversions (form fills, purchases, pipeline), and health (Core Web Vitals, indexation, errors) in one view.
| Metric Category | Key Metrics | Update Frequency | Benchmark / Target |
|---|---|---|---|
| Visibility | Clicks, impressions, CTR, avg position | Weekly (Google Search Console) | CTR by position (5–27%); 30%+ monthly growth in clicks |
| Traffic Quality | Organic sessions, branded vs. non-branded, engagement time | Weekly (GA4) | 2.4% avg conversion rate; non-branded session growth ≥ 15% QoQ |
| Impact & Revenue | Organic conversions, conversion rate, organic revenue, CAC | Weekly (GA4 + CRM) | 2.4%–7% conversion rate (by page type); monthly revenue growth ≥ 10% |
| Health | Core Web Vitals, indexation %, crawl errors | Monthly (Google Search Console) | All Core Web Vitals in "Good"; 95%+ indexation; <5 crawl errors |
The most actionable measurement setup uses a monthly dashboard with four panels: Visibility (rankings, CTR), Traffic (sessions, non-branded %), Conversions (conversion rate, revenue), and Health. Each metric is tracked month-over-month, with alerts for red flags (CTR drops 20%, conversion rate falls below your baseline, crawl errors spike). This structure surfaces problems in real time rather than burying them in raw data.
Teams that move fastest use automated SEO reporting tools to pull data from Google Search Console, GA4, and their CRM weekly, then surface trends and anomalies without manual work. The alternative—manual spreadsheet updates—is how SEO insights get stale and teams miss growth opportunities. For busy founders juggling multiple priorities, this automation becomes a competitive advantage. Content marketing automation takes the same principle to your publishing workflow, delivering fresh content with built-in conversion tracking so you can measure what actually works.
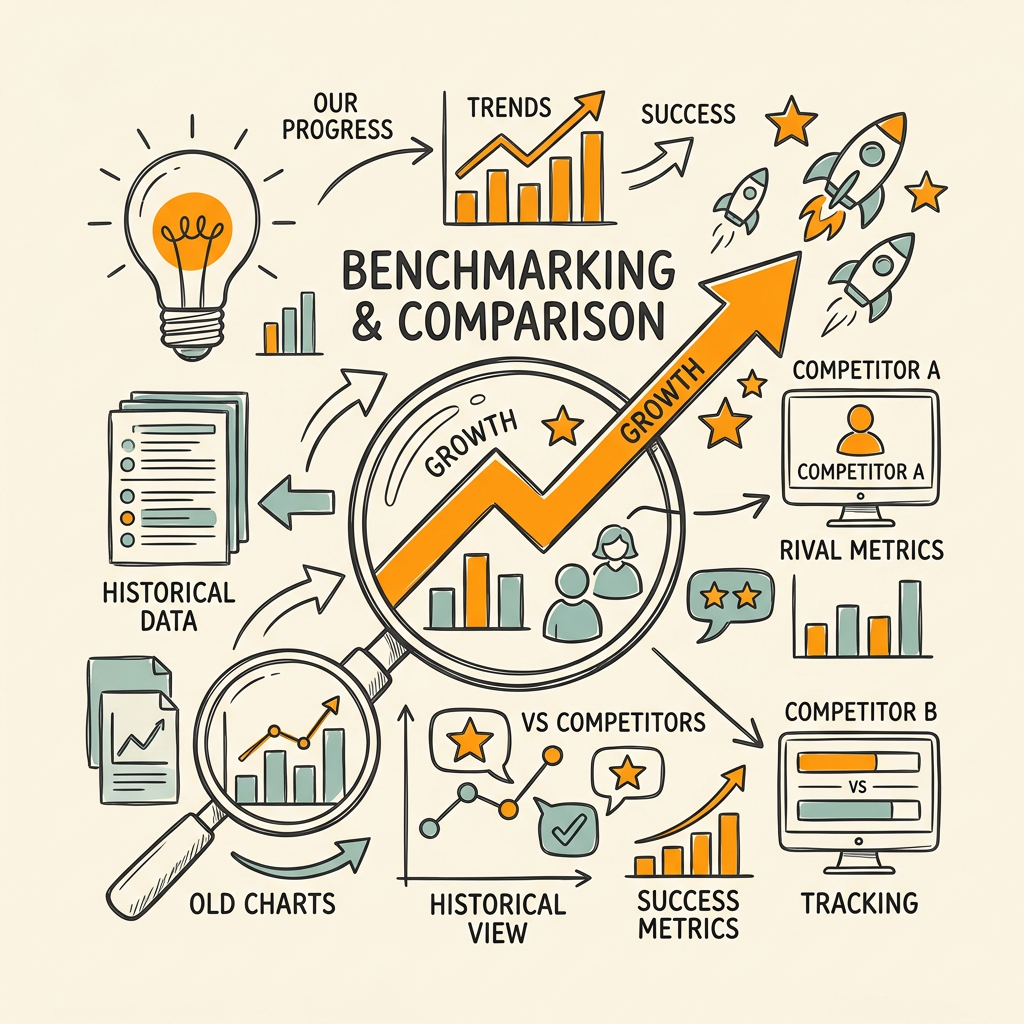
Benchmarking Against Competitors and Historical Data
Benchmarks tell you if your metrics are healthy or if you're underperforming. But the strongest benchmark is your own historical performance: if your conversion rate was 3% six months ago and is now 2.5%, something degraded. Industry averages (2.4% conversion rate, 27.6% CTR for rank #1) are useful reference points, but they mask huge variation by industry, traffic intent, and page type.
The most actionable benchmarking approach:
- Compare month-over-month trends in your own data. Is organic conversion rate rising, stable, or falling? Is non-branded traffic growing faster than branded? These trends show whether your program is improving.
- Segment benchmarks by page type and intent. Your product pages will convert at 5–10%, while top-of-funnel blog posts might convert at 0.5–1%. Comparing a blog post's conversion rate against your product page benchmark is meaningless and misleading.
- Benchmark organic CAC against your paid channels. If your organic CAC is $200 and your Google Ads CAC is $400, organic is winning. This comparison justifies sustained investment in SEO.
- Use 6–12 month windows for trend analysis. One month of data is noise. Six months shows real direction; 12 months shows seasonal patterns and multi-quarter trends.
Common Measurement Mistakes to Avoid
Even well-meaning teams stumble into measurement traps that make their SEO program look successful when it's actually underperforming.
- Blending branded and non-branded traffic. Branded traffic converts 2–3x higher and grows predictably. Mixing it with non-branded masks whether you're actually capturing new demand. Always segment.
- Using sitewide conversion rate instead of by-page segmentation. Your homepage, product pages, and blog posts have wildly different conversion rates. Reporting a single sitewide rate hides which content types are pulling their weight.
- Attributing all conversions to the last touchpoint. Organic search is often an early-funnel touchpoint. Last-click attribution undercounts its influence. Always measure assisted conversions too.
- Ignoring cost in ROI calculations. If you're spending $5,000/month on salaries, tools, and content but only measuring revenue, you're not calculating ROI. Total cost of SEO (including labor) divided into revenue is the real formula.
- Tracking too many metrics. If your dashboard has 30 KPIs, you have no KPIs. Focus on 5–7 core metrics. Everything else is supporting data.
Automating SEO Measurement for Consistency
Manual measurement—weekly spreadsheets updated by hand, quarterly analysis done in isolation—is how SEO insights die. Teams get too busy to update the sheet, trends go unnoticed, and by the time someone reviews the data three months later, the opportunity to fix the problem is gone.
The solution is automated measurement. Tools that connect to Google Search Console, GA4, and your CRM pull fresh data weekly, calculate key metrics automatically, and surface anomalies via alerts or reports. This keeps measurement current and enables faster action. When you're running a lean marketing operation, this automation is the difference between knowing what's working and flying blind.
Because Jottler publishes high-quality content at scale through autonomous SEO, it tracks conversion rate and engagement metrics by article across your publishing schedule. Instead of guessing whether new content will convert, you see real performance data week-by-week, which pages are generating the most non-branded traffic, and which ones drive organic revenue. This feedback loop is how founders at scaling companies compound their organic growth without manually analyzing dozens of spreadsheets. The autonomous SEO agent approach means you're not just publishing more content—you're publishing smarter content informed by real measurement.
Conclusion
Rankings are a starting point, not a finish line. 49% of marketers now prioritize organic search as their top ROI driver, but that advantage only accrues if you're measuring the right metrics. Conversion rate, organic revenue, non-branded traffic share, and technical health are the four pillars of SEO success. Teams that track these metrics unlock a clear view of what's working, where to invest, and how to prove ROI to leadership. The gap between rank-focused teams and revenue-focused teams will only widen in 2026—pick which side you want to be on now.
Start this week: audit your current measurement system. Do you have organic conversion rate segmented by page type? Can you calculate organic CAC and compare it to paid? Are you tracking non-branded traffic separately? If the answer to any of these is no, you're flying blind. Set up these four core metrics, track them weekly, and watch how your SEO program transforms from a guessing game into a predictable revenue engine.
Start your SEO agent to automate the content creation process that feeds this measurement system. Publish more content with better conversion tracking and turn your measurement data into quarterly compounding growth.
FAQs
What is a good organic conversion rate for SEO?
The industry average is 2.4%, but this varies dramatically by industry, page type, and intent. Legal and financial services often hit 7%+, while top-of-funnel educational content might sit at 0.5–1%. The most useful benchmark is your own historical data and your closest competitors within your vertical. If your product page converts at 3% and your blog post converts at 0.8%, both are likely healthy—they're designed for different buyer stages. Focus on whether each page type is improving month-over-month rather than hitting a single industry number.
How do I measure organic revenue and SEO ROI accurately?
Connect your analytics to your CRM and measure organic-sourced pipeline value, not just last-click revenue. Filter your CRM for opportunities and closed deals where the customer's first or early touchpoint came from organic search, then calculate the total pipeline value. For ROI, divide total organic revenue (or pipeline value) by total SEO cost—salaries, tools, content production, agencies, everything. This formula reveals the true return: a well-executed organic program generates 748% median ROI, with top performers hitting 900%–1,100%+ or higher. Track this monthly and compare it against your paid channel ROI to prove where your budget should flow.
Should I focus on rankings or organic traffic for SEO measurement?
Focus on organic conversion rate and revenue, not just traffic volume. Rankings are a leading indicator—they enable traffic—but traffic itself is only valuable if it converts. You can rank #1 for 100 keywords and have zero profit if those visitors don't take action. Instead, measure conversion rate by landing page and intent, track organic revenue by content type, and watch non-branded traffic growth to prove you're capturing new demand. Use rankings and CTR as supporting metrics to optimize your titles and pages, but always anchor your success to the metrics that matter to your business: conversions, pipeline, and revenue.