Reading Your Traffic Data: From GA4 to Real Decisions
Most marketing teams collect vast amounts of GA4 data but struggle to act on it. Over 80% of GA4 implementations have broken or missing event configurations, and 41% of marketers cannot measure cross-channel performance effectively. The problem isn't a lack of data—it's the inability to translate numbers into decisions. Your traffic source report might show an 18% increase in organic sessions, but what does that mean for your product roadmap, content strategy, or budget allocation? This guide bridges that gap, walking you through how to read GA4 traffic data and extract decisions that actually move your business.
Key Takeaways
- 80% of GA4 setups lack proper event configuration (Search Engine Journal, 2026), making data interpretation unreliable unless you audit tracking first.
- Engagement rate, not raw traffic volume, is the primary quality signal—channels with engagement rates below 40% signal content misalignment.
- Only 38% of marketers have connected GA4 to their CRM, blocking true end-to-end attribution and revenue impact analysis.
- Audit Your Event Configuration: Verify that GA4 is tracking what you intend, eliminating noise from duplicate events or missing key interactions.
- Prioritize Engagement Over Volume: 68% of high-performing marketers focus on engagement rate (2026) rather than session counts when evaluating channel quality.
- Build Custom Channel Groupings: Move beyond default "Organic Search" to capture AI referrer traffic and brand-specific initiatives separately.
- Map Traffic Sources to Revenue: Connect GA4 to BigQuery or your CRM to see which channels actually drive customer acquisition and retention.
- Track Assisted Conversions: Use GA4's data-driven attribution to identify sources that initiate journeys, not just close sales.
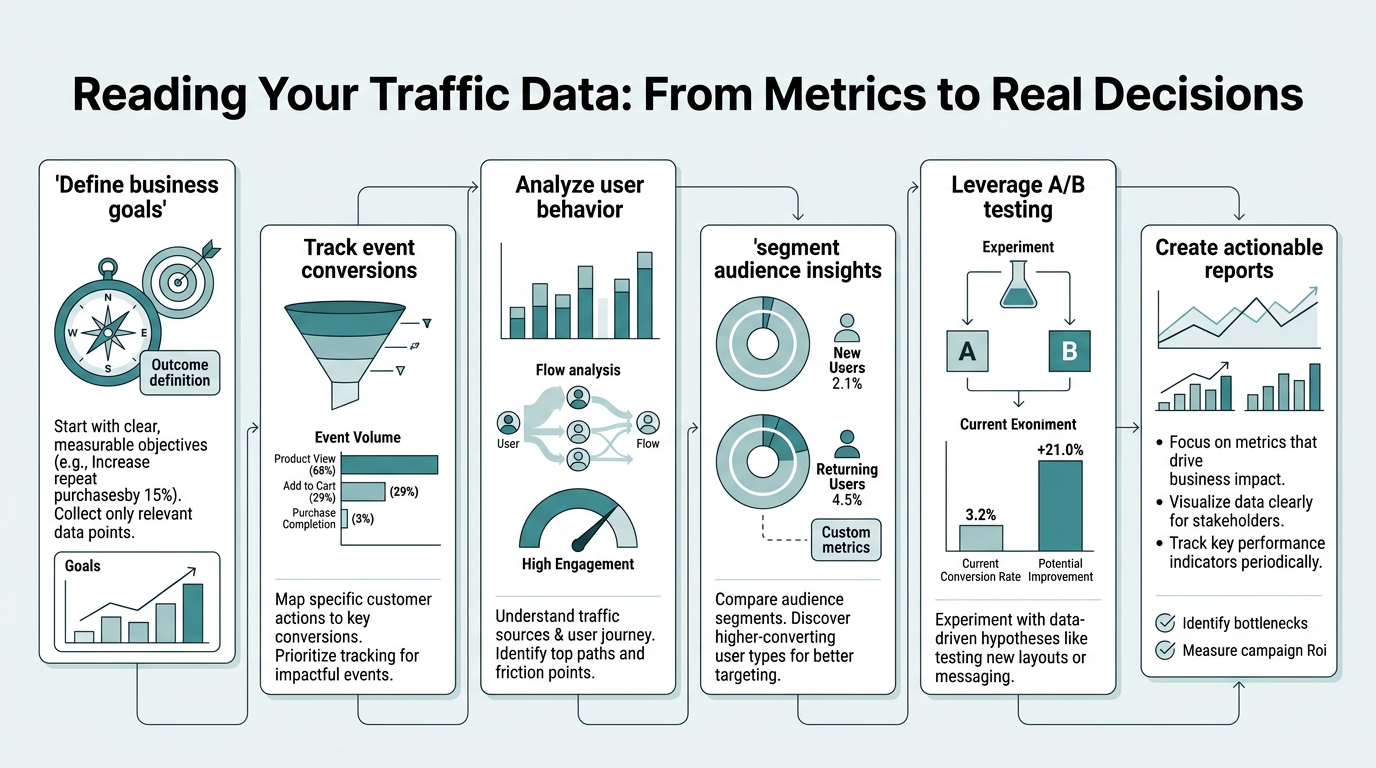
Why Traffic Data Interpretation Matters More Than Raw Numbers
Raw session counts are vanity metrics. When your organic search traffic jumps 25%, that's only valuable if those sessions convert, engage with your content, or lead to downstream business outcomes. Only 28% of GA4 users fully utilize event-based tracking, which is the foundation of meaningful interpretation. Most teams default to counting pageviews or sessions—metrics that GA4 has deliberately de-emphasized in favor of engagement and events.
The shift from Universal Analytics to GA4 rewired how analytics works. In legacy GA, you traced the last-click source and called it the winner. In GA4, you trace the entire journey—which source initiated the user, which assisted in building intent, and which closed the deal. This requires asking different questions of your data.
"Without interpreting data in context, you make budget decisions backwards. A channel with lower volume but 5x higher engagement and conversion rates is worth more than a high-volume, low-quality source."
The Problem: Data Without Context
A founder reviewing GA4 data sees that paid social drove 2,000 sessions last month, but organic search drove 8,000. The instinct is to cut paid social spending and pour more into SEO. But what if those 2,000 paid social sessions have a 58% engagement rate and convert at 4.2%, while the 8,000 organic sessions have a 22% engagement rate and convert at 0.8%? The paid social users are far more valuable, even at lower volume. Without interpreting the data in context, you make budget decisions backwards.
The Solution: Question-Driven Analysis
Instead of looking at traffic reports passively, approach GA4 with a business question. "Why did Q3 conversions drop despite flat traffic?" "Which channels are sending us leads that actually close?" "Is our content strategy attracting the right audience?" These questions force you to dig into engagement, attribution, and device behavior rather than surface-level volume metrics. That's where real insights emerge.
How to Navigate the GA4 Traffic Acquisition Report
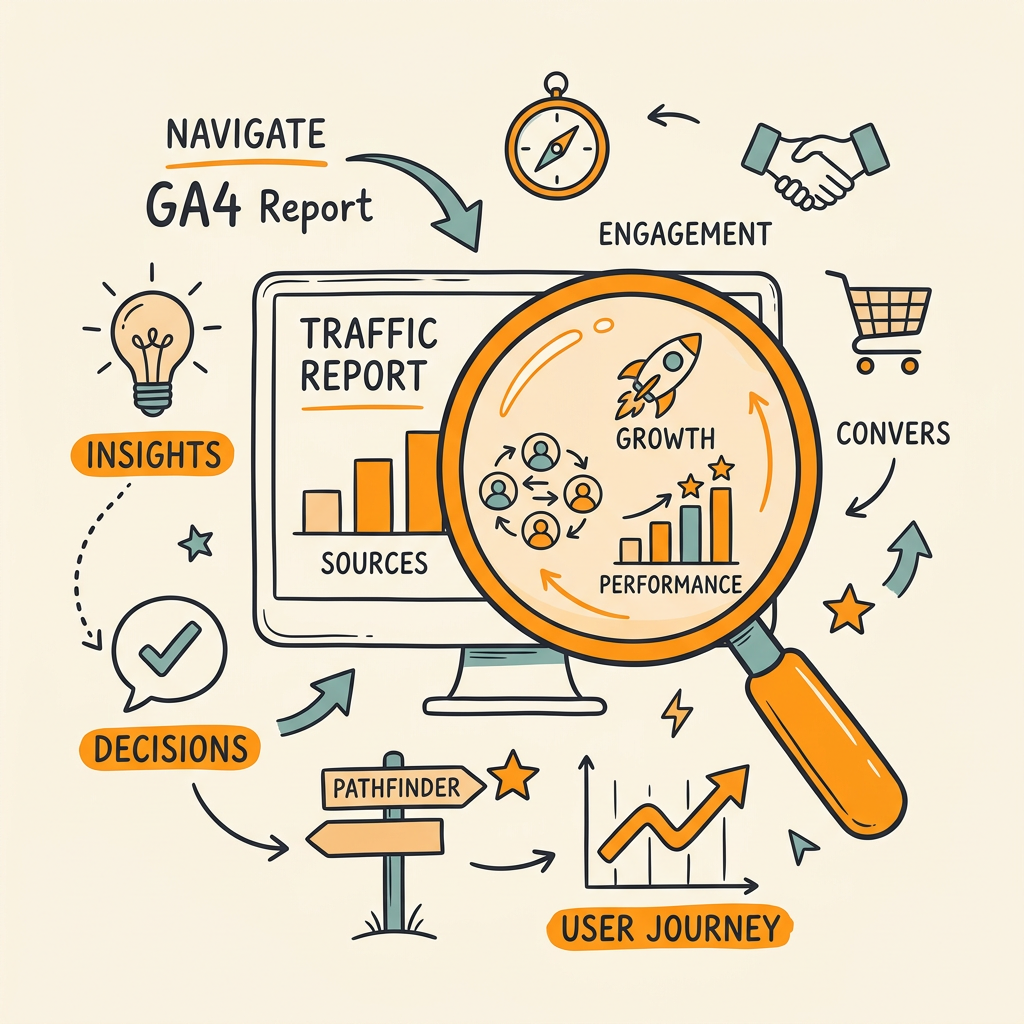
GA4's Traffic Acquisition report is the entry point for most traffic analysis, but it's also where teams get lost. The default view shows sessions by source and medium, but it doesn't automatically surface which channels deliver quality users or revenue impact. According to Semrush's traffic sources guide, you need to know where to look and what to layer on top.
Setting Up Your Primary Dimension Correctly
The Traffic Acquisition report defaults to "Session default channel group," which buckets traffic into broad categories: Organic Search, Paid Search, Direct, Social, Email, Referral, and Other. This is useful for a 30,000-foot view, but it hides important details. 92% of GA4 users start with this default grouping, and many never move beyond it.
For deeper analysis, switch the primary dimension to "Session source / medium," which shows you the exact platforms (Google, Facebook, direct traffic via a branded campaign, etc.) and their traffic type. This reveals outliers and hidden opportunities.
- Organic Search vs. Organic Social: Organic Search is free and repeatable; Organic Social often spikes when someone shares your link but doesn't compound.
- Paid Search vs. Paid Social: Paid Search captures high-intent users actively searching for your solution; Paid Social reaches awareness-stage audiences with lower immediate conversion intent.
- Referral Traffic: This includes links from other websites and now increasingly from AI platforms. You need custom grouping to separate high-quality referrals from low-value ones.
- Direct Traffic: Users who typed your URL directly or came from bookmarks. High direct traffic signals brand strength but can also hide tracking issues.
Adding Meaningful Secondary Dimensions
Once you've selected your primary dimension, layer in secondary dimensions to uncover why traffic patterns are what they are. A secondary dimension adds a second variable to the table, revealing patterns raw numbers don't expose.
If you're analyzing organic search traffic, add "Landing Page" as a secondary dimension. Now you can see which keywords or internal pages attract the most users. If one page attracts 800 sessions but has a 12% engagement rate while another attracts 400 sessions with a 65% engagement rate, the second page is winning on quality. That's the insight that leads to action.
Other high-value secondary dimensions include Device Category (mobile vs. desktop), Country (geographic opportunity), and Campaign (if you've properly set up UTM parameters in paid traffic). Each reveals friction or opportunity.
Interpreting Engagement Rate as Your True Quality Signal
Volume is a lagging indicator of success; engagement is a leading indicator. 68% of high-performing marketing teams prioritize engagement rate over session counts when evaluating channel quality, according to 2026 research. This represents a fundamental shift from counting traffic to measuring its value.
What Engagement Rate Actually Measures
In GA4, "engagement rate" is the percentage of sessions where users triggered at least one conversion event or spent more than 10 seconds on the site. It's GA4's way of saying "did this user take an action we care about?" Sessions with zero engagement are bounces—users who landed and left without interacting.
"A high engagement rate indicates one of three things: your audience is highly relevant to your content, your page experience is compelling, or both. A low engagement rate signals misalignment between what you're promising and what users find."
A high engagement rate indicates one of three things: your audience is highly relevant to your content, your page experience is compelling, or both. Conversely, a low engagement rate signals misalignment between what you're promising in your ad or search result and what users find on the landing page.
Benchmarking Engagement Rate by Channel
Different channels have naturally different engagement rates. Organic search typically performs well (50-70% engagement) because search queries are intent-driven. Paid social usually sits lower (25-45%) because awareness-stage audiences aren't yet ready to convert. Direct traffic often has high engagement because returning users know what they want. The key is comparing performance within each channel over time, not across them.
| Channel | Typical Engagement Rate | Red Flag (Below) | Action Trigger |
|---|---|---|---|
| Organic Search | 50–70% | 35% | Audit content relevance to search intent; test headline and meta description clarity |
| Paid Search | 45–65% | 30% | Refine keyword targeting; test landing page copy alignment with ad messaging |
| Paid Social | 25–45% | 15% | Widen audience targeting (too narrow = wrong demographic); test creative formats |
| 40–60% | 25% | Segment list by user type; test email frequency and send time optimization | |
| Direct | 55–75% | 40% | Investigate tracking setup (likely missing or misconfigured parameters) |
| Referral | 35–55% | 20% | Audit referring domains for relevance; prioritize partnerships with high-engagement referrers |
Use this table as a reference, not gospel. Your industry, product stage, and audience maturity all affect expected engagement rates. The actionable insight comes when you spot a channel trending down, not just appearing low once. If your email engagement dropped from 52% to 31% over two months, that's a signal to investigate. If paid social has always been 32%, and you're running awareness campaigns, that's normal.
The Engagement Rate + Conversion Rate Pairing
Engagement rate alone doesn't drive revenue. Pair it with conversion rate—the percentage of sessions that completed a key event like "purchase," "signup," or "demo request." This pairing reveals the full picture.
You might have a channel with 60% engagement but only 0.5% conversion rate. High-intent audience, but low sales follow-through. That signals a funnel problem, not a traffic problem. Or you might have 35% engagement and 2.8% conversion. Lower engagement, higher conversion. That channel is attracting a smaller but more sales-ready audience—potentially worth more per dollar spent despite lower traffic volume.
Building Custom Channel Groupings to Capture Modern Traffic Sources
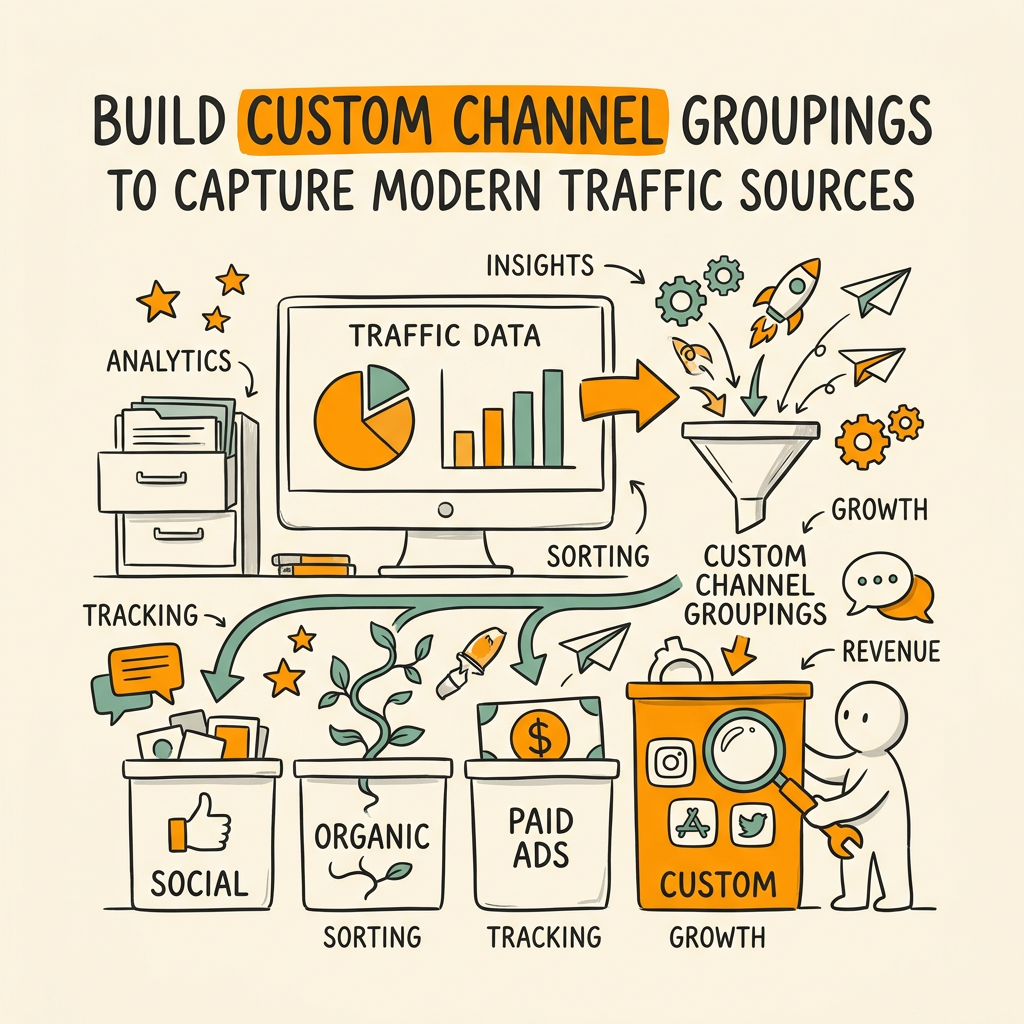
GA4's default channel grouping worked fine in 2023. In 2026, it's incomplete. AI-driven referrer traffic now accounts for 12–15% of organic traffic in tech and B2B sectors, yet GA4 lumps it into "Organic Search" alongside Google. Custom channel groupings let you separate signal from noise and track what actually matters to your business.
Why Default Channel Grouping Breaks Down
The default groups are: Organic Search, Paid Search, Organic Social, Paid Social, Email, Direct, Affiliate, Referral, and Other. This taxonomy was built for 2015 traffic patterns. Today, you have:
- AI search engines (Perplexity, ChatGPT, Claude) sending referral traffic that looks like organic search but comes from different sources
- Newsletter platforms (Substack, Beehiiv) that deserve their own tracking, not lumped into "Referral"
- Affiliate and partnership traffic that you want to monitor separately to calculate partner ROI
- Internal campaigns (product announcements, employee referrals, internal testing) that pollute cross-channel attribution
Without custom groupings, these sources hide in "Other" or get misclassified, breaking your attribution model.
Building Your First Custom Channel Grouping
Custom channel groupings live in GA4's Admin section under Data Display > Channel Groups. Google provides a default template, but you should build your own to match your business. Here's how:
- List your traffic sources: Go through your last 90 days of traffic reports and list every unique source you see. Don't overthink it; capture everything.
- Group by business logic: Which sources compete for the same marketing budget? Which drive different types of users? Organize them into 6–10 groups that matter to your strategy.
- Define rules: For each group, specify which source/medium combinations map to it. Example: if "source is 'perplexity.com'" and "medium contains 'referral'," assign to "AI Search Referral."
- Backfill data: Custom groupings apply to future data only. Run an Exploration in GA4 to manually classify your historical traffic using filters.
Once live, your Traffic Acquisition report will bucket traffic into your custom groups, making patterns visible that were hidden before. A founder at an SEO-focused SaaS company realized half of "Referral" traffic was actually AI platform referrers. They started optimizing for those platforms as a separate growth channel, tripling AI referrer revenue in six months.
Connecting GA4 to Revenue and Business Outcomes
Traffic data in isolation is theater. Real decisions come when you tie traffic to revenue or other business outcomes. Only 38% of marketers have connected GA4 to their CRM, which means 62% are making budget decisions blind to actual customer acquisition cost and lifetime value by channel.
The Case for CRM Integration
Your GA4 session ends when the user leaves your website. Your customer journey continues in your CRM, email platform, or product usage data. If you can't see which GA4 traffic source led to a paying customer, you're optimizing for the wrong metrics.
"Connect GA4 to your CRM to see which traffic sources actually drive paying customers. You might discover that organic search drives half your revenue but paid search drives customers with 5x higher lifetime value—completely reshaping your budget allocation."
Connect GA4 to Salesforce, HubSpot, Pipedrive, or your custom CRM by passing a unique user ID from your website to your CRM. Then run a report in GA4 that shows "Users who became paying customers, grouped by traffic source." Suddenly, organic search might look like it drives half your revenue, but paid search drives customers with 5x higher lifetime value. That insight reshapes your entire budget allocation.
BigQuery: The Power Move for Advanced Analysis
If your CRM integration feels clunky, BigQuery is GA4's native power tool. Google exports all of your GA4 data to BigQuery, a data warehouse where you can run SQL queries to answer complex questions. For technical guidance on advanced GA4 analysis, Search Engine Journal's comprehensive GA4 report covers both implementation and analysis best practices.
Example query: "Which traffic sources sent users who generated the most revenue in their first 90 days?" This blends session-level data (GA4) with customer-level revenue data (your payment system or CRM). You'd run a JOIN query that matches users from GA4 to your customer database, filters for revenue in days 0–90, and groups by traffic source.
Most teams don't have SQL expertise in-house, so BigQuery queries often require hiring a consultant or building a custom analytics tool. But for SaaS companies and e-commerce businesses with significant revenue impact, it's worth the investment. Approximately 40% of enterprises use GA4's BigQuery integration, and the teams that do consistently outpace competitors on marketing ROI.
Simpler Alternative: Conversion Events and Attribution Modeling
If BigQuery feels too heavy, GA4's built-in attribution modeling is your middle ground. Define key conversion events (signup, trial start, purchase, demo request), assign them monetary values if applicable, and GA4 will show you "Assisted Conversions"—conversions that a channel influenced but didn't close.
In the default "Last Click" model, only the final touchpoint gets credit. Switch to "Data-Driven Attribution" to see the full picture. A user might land from paid social (awareness), then organic search (consideration), then email (conversion). In data-driven attribution, all three sources get credit weighted by their actual influence. This prevents you from over-investing in last-click channels at the expense of awareness-stage traffic that feeds the funnel.
Spotting Data Quality Issues Before They Poison Your Decisions
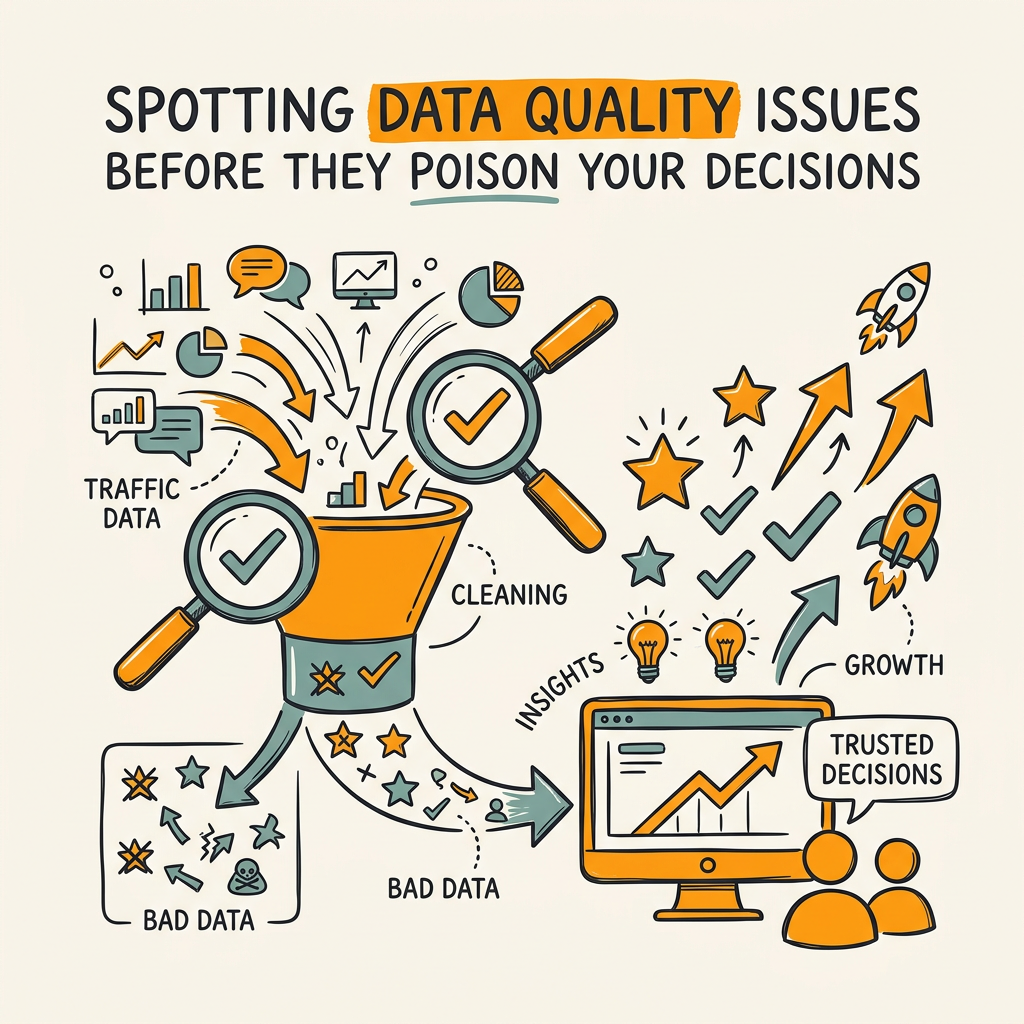
Garbage in, garbage out. If your GA4 setup is broken, every decision you make based on that data is a mistake waiting to happen. Circlesstudio's GA4 best practices guide outlines common configuration issues that skew results. Before you act on any traffic insight, audit data quality.
The Top Five GA4 Configuration Problems
80% of GA4 implementations have broken or missing event configurations (Search Engine Journal, 2026). Here are the most common culprits:
- Duplicate Event Firing: The same event triggers twice due to redundant tags or misconfigured triggers. Result: inflated event counts, skewed engagement rates, broken conversion tracking.
- Missing UTM Parameters in Paid Traffic: If your ads don't pass utm_source, utm_medium, and utm_campaign, GA4 classifies them as "Direct" or "Referral." Your paid campaign performance becomes invisible.
- Internal Traffic Not Filtered: Your team's traffic (testing, browsing, QA) counts as real user sessions. If your company has 50 employees and your site gets 200 daily sessions, internal traffic is 25% noise.
- Event Names Too Generic: Events named "click" or "view" don't tell you what the user clicked or viewed. Standardize naming: "signup_button_clicked" vs. just "click."
- No View Filter for Bot Traffic: Spam crawlers and click fraud inflate your session counts and pollute your data. GA4 has automated bot filtering, but manual IP exclusions for your office, QA environment, and known spam sources add precision.
Quick Audit: The Five-Minute GA4 Health Check
Open your GA4 reports and run this basic audit:
- Compare this month's total sessions to last month. If traffic moved more than 30% without a known marketing change, investigate.
- Check the "Event Count" metric. If it's wildly higher than expected, you likely have duplicate firing.
- Segment Organic Search by Landing Page. If a non-content page (e.g., "privacy policy") is driving tons of organic traffic, your tracking is likely misconfigured.
- Filter by your office IP address (Admin > Data Filters). You should see minimal traffic from that IP. If it's significant, create an IP-exclusion filter for your office and QA environment.
- Check the "User Acquisition" report. If 50%+ of your traffic lacks a source attribution (shows as "unassigned"), you have UTM or campaign tracking gaps in paid channels.
Fix these issues before scaling any channel or making budget decisions. One founder discovered their "Organic Search" traffic was 40% internal testing and bot hits. After filtering, her organic search volume looked lower but engagement rate jumped from 38% to 58%, revealing that real organic traffic was actually performing better than she thought.
Turning Traffic Insights into Strategic Decisions
You've now read your traffic data, identified patterns, and verified data quality. The final step is converting these insights into business decisions. This is where most teams falter—they gather intelligence but don't act on it. For teams looking to scale content production systematically, a strategic content marketing framework paired with consistent GA4 analysis ensures your traffic gains compound over time.
The Decision Framework: Volume → Quality → Revenue
Use this three-step framework to evaluate any traffic source or channel shift:
- Volume: Is this channel sending meaningful traffic? "Meaningful" depends on your site. If you get 50,000 monthly sessions, 500 from a channel is 1%—probably not worth optimizing. If you get 5,000 monthly sessions, 500 is 10%—worth investigating.
- Quality: What's the engagement rate? If it's below your channel baseline, dig into why. Poor engagement often signals audience misalignment or landing page friction, both fixable problems.
- Revenue: If possible, track the channel to downstream revenue or customer acquisition. A channel with low traffic and low engagement might still drive your highest-LTV customers. Or a high-volume, medium-engagement channel might drive zero revenue. This is where real ROI emerges.
Example decision: Your paid social traffic is down 30% month-over-month. Running through the framework:
- Volume: The channel still sends 5,000 sessions—still 8% of your traffic. Material enough to care.
- Quality: Engagement rate is unchanged at 32%. The drop is purely volume, not performance degradation.
- Revenue: Check CRM data. Paid social leads are closing at the same rate as before.
Conclusion: The traffic drop is likely a campaign pause or budget cut, not a platform problem. You can either increase budget to restore volume or hold steady and monitor if engagement or conversion rates improve with a smaller, more targeted audience.
Building Momentum Through Content and Channel Iteration
Traffic insights are most valuable when they feed continuous improvement. Use GA4 data to inform autonomous content strategies that scale organic traffic systematically, testing incrementally rather than making massive bets.
If organic search traffic is high-quality but low-volume, your SEO strategy might be missing keywords. Consistent content production with proper keyword research and SEO optimization can compound organic traffic over quarters. If paid social engagement is low, test new creative formats—video, carousel ads, dynamic product ads—and measure engagement shifts within 2-week windows.
The key is closing the loop. Insight → Action → Measurement → Insight. Most teams break this cycle by gathering insights but never returning to measure whether the action worked. In GA4, set yourself a monthly cadence: run your traffic reports, spot one trend or anomaly, take one small action, and measure the result next month.
Avoiding the Pitfalls That Trap Most Teams
Even with proper data interpretation, teams stumble. Here are the common traps and how to avoid them.
Trap 1: Optimizing for the Wrong Metric
Session growth looks good in dashboards. Revenue growth looks better. If you optimize GA4 reporting for sessions, you'll eventually spend on traffic that doesn't convert. Instead, make conversion events and revenue your primary metrics, and use traffic volume as a supporting metric. If a channel has high volume but low conversion, either fix the funnel or shift budget.
Trap 2: Ignoring Seasonality and External Factors
Traffic doesn't exist in a vacuum. In December, B2B software sees a dip as buyers pause spending. In January, it surges. If you're comparing January traffic to November traffic without accounting for seasonality, you'll misdiagnose growth. Always compare year-over-year or apply seasonal adjustment factors.
Trap 3: Making Decisions on Incomplete Data
GA4 data can lag 24–48 hours. More importantly, some sources take weeks to show full impact. A blog post published today won't drive meaningful organic traffic for 30–60 days. An email campaign's full effect takes 7 days to materialize as return visits. Don't optimize based on day-to-day fluctuations; use 30-day rolling averages and quarterly reviews.
Conclusion
Reading your GA4 traffic data isn't about mastering reports—it's about asking the right questions and trusting the answers. The core insight is simple: engagement rate and revenue impact matter far more than session volume. Volume is easy to inflate; quality is hard to fake.
Start with three actions: audit your event configuration to ensure data reliability, build custom channel groupings to separate signal from noise, and connect traffic to revenue outcomes so every decision is informed by business impact, not vanity metrics. These three moves will reshape how you interpret GA4 and translate traffic data into strategy.
For teams working with consistent, high-volume content production, automated systems that feed organic traffic with fresh, SEO-optimized articles can dramatically improve data quality and volume over time. Start your SEO agent to automate research, writing, and publishing—turning traffic insights into growth velocity.
FAQs
What is a good engagement rate in GA4 by channel?
Engagement rates vary significantly by channel and audience stage. Organic search typically ranges from 50–70%, paid search 45–65%, direct traffic 55–75%, and paid social 25–45%. However, the real signal isn't the absolute number—it's the trend. If your paid social engagement drops from 40% to 20% over two months, that's a red flag worth investigating. Compare your channels month-over-month and year-over-year to spot changes that indicate either a problem (audience misalignment, landing page friction) or an opportunity (targeting improvements, creative testing success). Benchmarking against your own historical data is more valuable than industry averages.
How do I know if my GA4 traffic data is accurate?
Run a five-minute audit to spot the most common problems. First, check if organic search traffic includes non-content pages like your privacy policy—if so, your tracking is likely misconfigured. Second, filter by your office IP address—if it shows significant traffic, you're capturing internal testing as real user data. Third, look at event counts relative to sessions. If events per session are extraordinarily high (10+ events per session on average), you likely have duplicate event firing. Fourth, verify that paid traffic has proper UTM parameters by checking the User Acquisition report for "unassigned" traffic. If more than 30% shows as unassigned, you're missing campaign tracking. Finally, compare this month's total sessions to last month. A jump or drop greater than 30% without a known cause (campaign launch, outage, algorithm change) signals a data quality issue worth investigating further.
What should I do if a traffic channel suddenly drops or spikes?
Sudden changes almost always have external causes—a platform algorithm change, a campaign pause, an outage, or a competitive shift. First, check if your tracking is intact. Run the data quality audit above to confirm events are firing correctly. Next, check the platform itself. If organic search traffic dropped, search for any Google algorithm updates or ranking changes in your category. If paid traffic dropped, verify your campaigns are still active and budgets haven't been paused. Third, segment the traffic by device, country, and landing page to see if the drop is concentrated (one page or device took a hit) or broad-based (entire channel affected). Concentrated drops often point to a specific page issue. Broad drops suggest platform or tracking issues. Finally, don't panic-react. Most traffic fluctuations self-correct within 2–3 days. Wait 48 hours before making major changes, then use 7-day rolling averages instead of daily data to avoid reacting to noise.