Real-Time SEO Dashboards That Actually Drive Decisions
Most SEO teams operate blind. They run audits, publish content, build links, then wait weeks to see if rankings moved. By then, the market has shifted, competitors have overtaken them, and opportunities have vanished. Real-time SEO dashboards solve this by surfacing what matters in minutes, not days. The difference? Teams that monitor dashboards with alert thresholds respond to ranking changes 10x faster than those waiting for monthly reports. This isn't just about speed—it's about reclaiming margin. When a dashboard shows a 20% traffic drop in real-time, you can diagnose and fix it before competitors notice. Here's how to build dashboards that actually move the needle.
Key Takeaways
- Real-time dashboards with alert-driven workflows reduce decision latency by hours, enabling SEO teams to respond to ranking volatility immediately (2026, Swydo).
- The sweet spot for executive dashboards is 3–5 core KPIs tied to business outcomes, not vanity metrics like keyword counts (2026, Vizup).
- AI-assisted dashboards that detect anomalies, flag trending keywords, and recommend next steps will dominate in 2026, replacing passive reporting with active decision engines.
Quick-Scan Guide: Core Dashboard Components
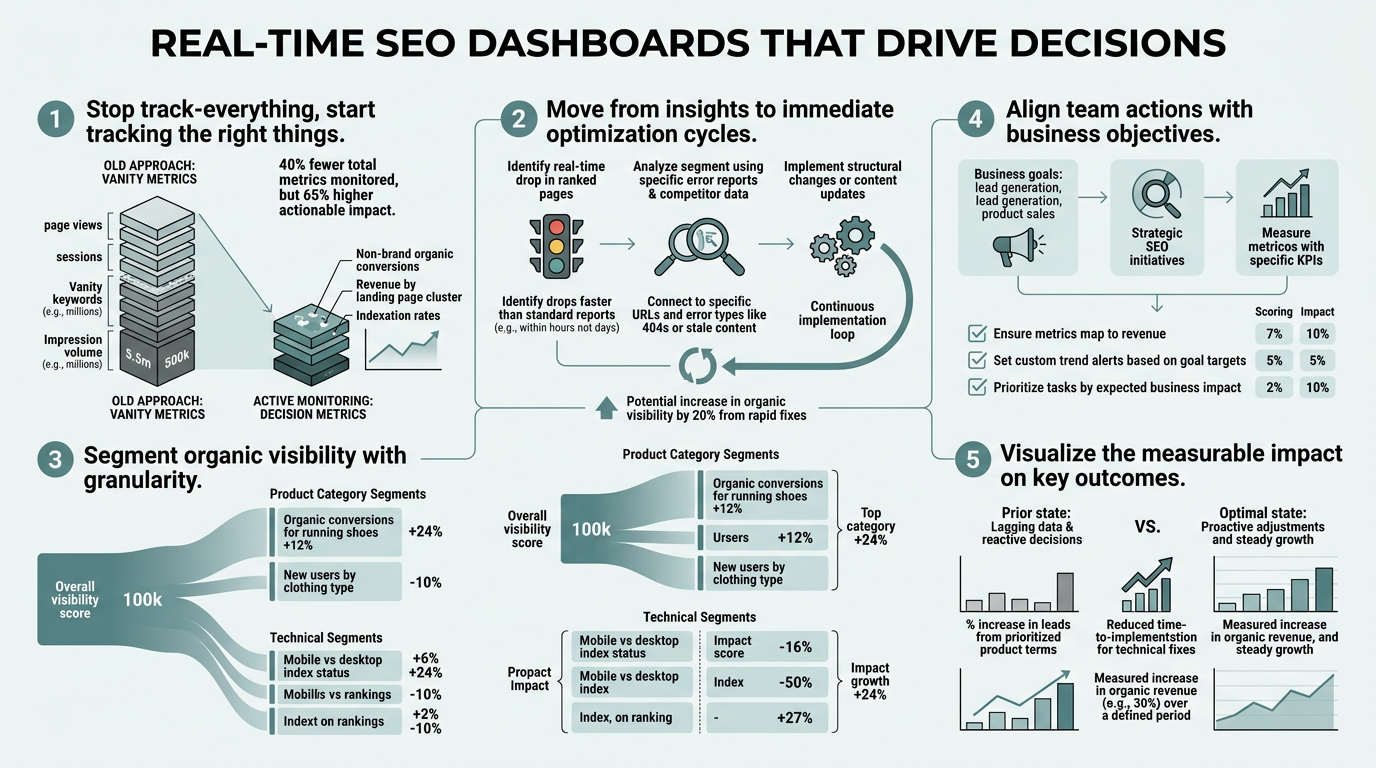
- Choosing the Right Metrics: Focus on business-outcome metrics like organic revenue, conversion rate, and traffic quality rather than vanity metrics like ranking volume.
- Building Alert Thresholds: Set automated alerts for ranking drops, traffic anomalies, and visibility shifts so your team reacts in hours, not weeks.
- Automating Data Integration: Use API-based connections between your rank tracker, Google Search Console, GA4, and CMS to keep dashboards live without manual work.
- Layering for Decision Speed: Create three views—raw data for analysts, monitoring layer for managers, executive summary for leadership—to ensure the right person sees the right insight at the right time.
- Embedding Actionability: Pair metrics with recommended actions, task assignment, and escalation rules so dashboards drive implementation, not just awareness.
How Do Real-Time Dashboards Differ From Static Reporting?
Real-time dashboards update as data arrives, often within seconds of a change; static reports are snapshots taken at scheduled intervals (daily, weekly, monthly). The difference determines whether you lead or follow market shifts. When a competitor's algorithm update drops your visibility by 15%, a real-time dashboard flags it immediately. A monthly report tells you weeks later. Real-time views excel at campaign monitoring and rapid response, while static dashboards serve better for performance reviews and trend analysis over longer periods. The key distinction is use case, not capability.
"The teams that adopt alert-driven monitoring workflows gain a competitive reaction time advantage measured in hours, not days. Speed creates compounding gains: catch issues faster, fix them faster, recover ranking position before traffic hits."
Real-Time Monitoring for Active Campaigns
Real-time dashboards shine when you're actively pushing content, managing promotions, or recovering from algorithm changes. Instead of discovering a ranking drop on Tuesday during your weekly review, a live dashboard alerts you on Monday at 2 p.m., giving you a full day to diagnose and respond. Teams that adopt alert-driven workflows gain a competitive reaction time advantage measured in hours. You can refresh underperforming content, adjust internal links, or escalate technical issues before competitors even notice the shift. This speed creates compounding gains—catch issues faster, fix them faster, and recover ranking position before your traffic hits. SEO automation tools that power real-time monitoring are increasingly essential for teams scaling from 1–5 articles per month to 10+ articles weekly.
Static Reports for Stakeholder Communication
Monthly or quarterly reports remain essential for leadership visibility, board communication, and historical analysis. A static dashboard lets executives see the big picture without being overwhelmed by daily noise. A static report also creates a clear record of performance over time, useful for attribution and ROI justification. The mistake most teams make is choosing one or the other. The right approach is both: real-time dashboards for operators (who need speed), static reports for executives (who need clarity and context). One drives decisions; the other communicates them.
When to Shift Between Views
Use real-time dashboards during high-stakes periods: content launches, competitor monitoring, algorithm recovery, and seasonal campaigns. Switch to static reporting during stable periods when you're optimizing content incrementally and don't need daily monitoring. Industry guidance recommends reviewing leading indicators weekly and lagging indicators monthly to balance speed with strategic accuracy. This hybrid approach keeps your team responsive without creating alert fatigue.
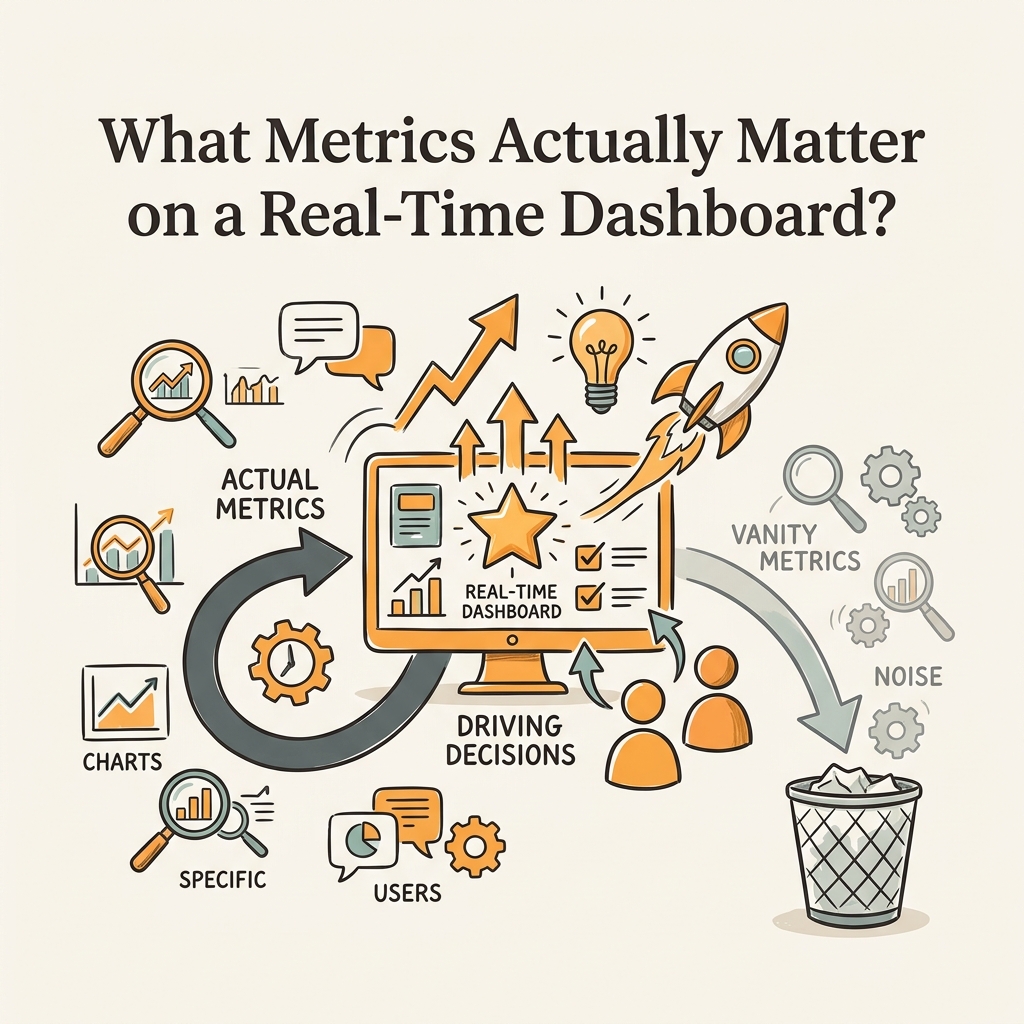
What Metrics Actually Matter on a Real-Time Dashboard?
Most dashboards fail because they track too many metrics and few of them tie to business outcomes. A bloated dashboard with 20+ metrics slows decision-making instead of speeding it up. Teams waste time debating which number to act on. The fix? Keep your executive dashboard to 3–5 core KPIs that directly connect SEO activity to revenue. Everything else moves to a diagnostic layer for analysts. This three-layer structure—raw data, monitoring metrics, executive KPIs—eliminates noise and accelerates decisions. As your content marketing automation scales, the ability to surface the right metric to the right person becomes your biggest competitive advantage.
The Three Layers of SEO Measurement
Build your dashboard architecture in three tiers. The bottom layer is raw data: keyword positions, search impressions, organic traffic sessions, backlinks, indexation status. The middle layer is monitoring metrics—trending keywords, traffic trends, ranking volatility, conversion rates from organic. The top layer is 3–5 business KPIs: organic revenue, conversion rate from organic, traffic quality score, cost per organic acquisition, contribution to pipeline. Each layer serves a different user. Analysts live in the raw data. Managers monitor the middle layer. Executives see only the KPIs. This separation means each person gets actionable insights, not information overload.
Core KPIs That Connect SEO to Revenue
Start with these four business-outcome KPIs:
- Organic Revenue shows the direct business impact of your SEO effort—often 20–40% of total website revenue at companies that prioritize SEO.
- Conversion Rate from Organic reveals traffic quality; organic visitors convert better than paid, so a rising conversion rate signals stronger keyword targeting.
- Cost Per Organic Acquisition measures efficiency—organic traffic compounds over time, so your CPA should decline as content ages and builds authority.
- Organic Traffic Growth Rate (month-over-month or quarter-over-quarter) shows momentum and indicates whether your content efforts are compounding.
These four KPIs answer the questions that matter to founders: Are we making money? Are we getting better? How much effort does it take? You can add a fifth KPI if needed (e.g., ranking visibility in AI answer engines), but more than five overwhelms decision-making.
"The most successful teams keep their dashboards simple, actionable, and aligned to how decisions actually get made. Your dashboard should answer one question for each person who uses it. If it answers more, simplify."
Monitoring Metrics to Support KPI Movement
Below the KPIs, track these operational metrics on your dashboard's second tier:
- Organic Traffic Volume and organic traffic trend (week-over-week) alert you to sudden drops.
- Keyword ranking distribution (how many keywords rank in top 10, top 30, top 100) shows visibility depth.
- Clicks and impressions from Google Search Console reveal which keywords drive clicks.
- Average CTR by position flags title-tag or meta-description issues.
- Backlink count and quality score track link-building progress.
- Core Web Vitals (LCP, FID, CLS) catch technical issues that kill rankings.
- Content freshness score (number of articles updated in the past 90 days) shows content velocity.
These metrics feed your KPIs. A rising impressions metric often precedes organic revenue growth. A CTR drop before traffic drops warns of a ranking issue.
| Metric Category | Executive View | Manager View | Analyst View |
|---|---|---|---|
| Business Outcome | Organic Revenue | Organic Revenue + Conversion Rate | Full revenue attribution model |
| Traffic Health | Traffic Trend (MoM) | Daily organic traffic + alerts | Traffic by device, landing page, query |
| Ranking Visibility | Visibility Score (0-100) | Ranking distribution + volatility | Keyword ranking changes, SERP feature data |
| Content Performance | Content ROI (revenue per article) | Top content by traffic + conversions | Individual page metrics, engagement, scroll depth |
| Authority | Domain authority trend | Backlink growth + quality | Backlink source analysis, anchor text distribution |
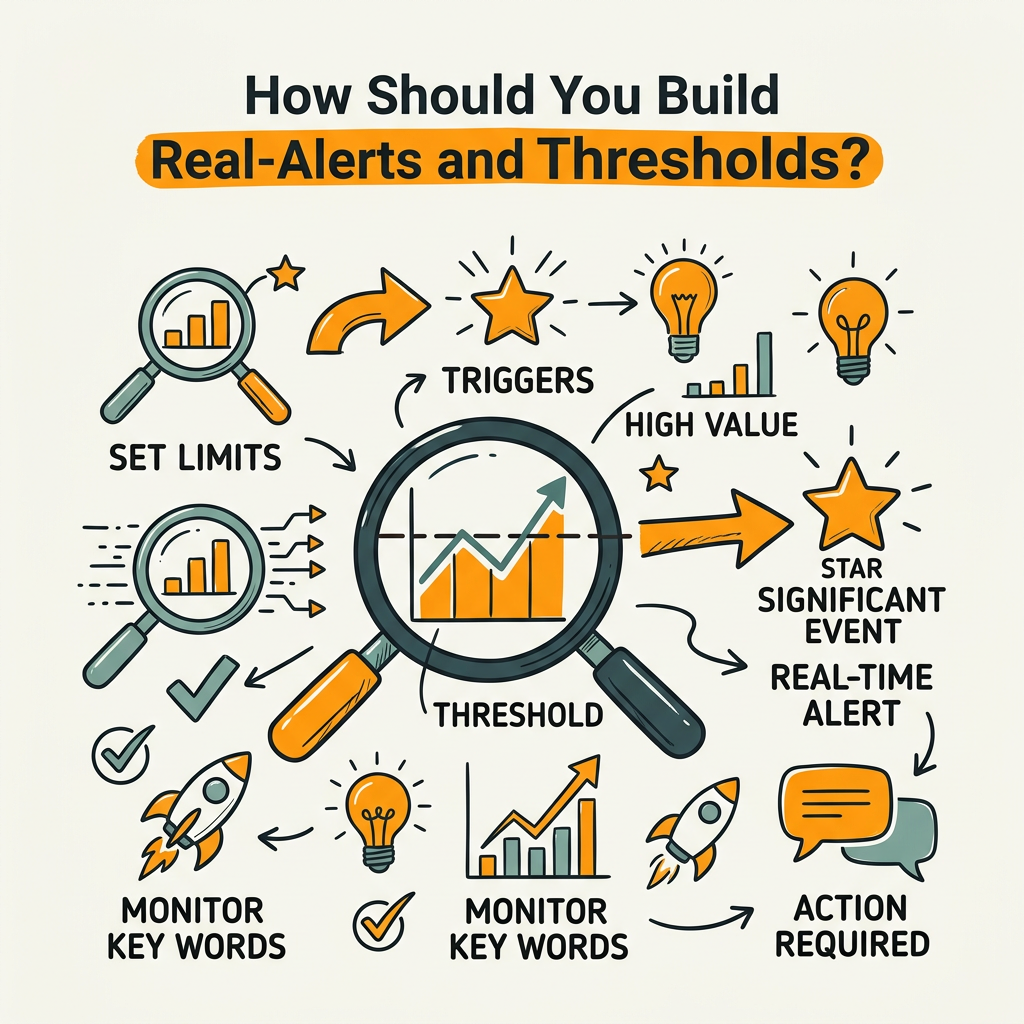
How Should You Build Real-Time Alerts and Thresholds?
Alerts without thresholds are noise; thresholds without alerts are ignored data. The art of real-time dashboards is setting alert rules that catch genuine issues without creating false alarms. A poorly configured alert system burns out your team; a well-designed one empowers them. Start by defining what "bad" looks like for your business, then program the dashboard to flag it automatically. This shifts your team from reactive (waiting for bad news) to proactive (responding to early signals).
Setting Ranking Drop Alerts
A 5-position ranking drop for a high-traffic keyword deserves immediate investigation. A 1-position drop for a long-tail keyword often corrects itself and creates alert fatigue. Set different thresholds based on keyword value:
- For keywords in your top 3 positions (generating 30–50% of organic traffic), alert on any drop.
- For keywords ranked 4–10, alert only if they drop more than 3 positions.
- For keywords 11–30, alert on drops exceeding 5 positions.
- For everything below position 30, turn off position-based alerts and use traffic alerts instead.
This prevents your team from chasing noise while catching the drops that matter.
Traffic Anomaly Detection with Thresholds
A 20% traffic drop over 90 days is a clear signal to refresh content or investigate technical issues. A 5% fluctuation between weeks is normal seasonality. Set your primary alert for sustained traffic declines: flag a drop if organic traffic is 15–20% below the rolling 90-day average for three consecutive days. This catches real problems without reacting to daily noise. Layer in secondary alerts for sudden spikes (often false positives from bot traffic) and for traffic that recovers organically (which tells you a temporary issue resolved itself). Most teams set traffic alerts at 10–15% change as the trigger point, but your threshold depends on your traffic volume and volatility.
Visibility and Click Alerts
Track impressions and clicks from Google Search Console separately from ranking position. A website can maintain rankings but lose clicks due to title-tag issues, meta description changes, or SERP feature cannibalization. Set alerts for click-through rate (CTR) drops exceeding 20% on your top-performing queries, and investigate whether Google is showing your snippet less prominently or showing competitor content instead. Impressions matter less than clicks; a high-impression, low-click scenario is often fixable with better copy. A low-impression situation means your visibility itself is dropping, which is more serious.
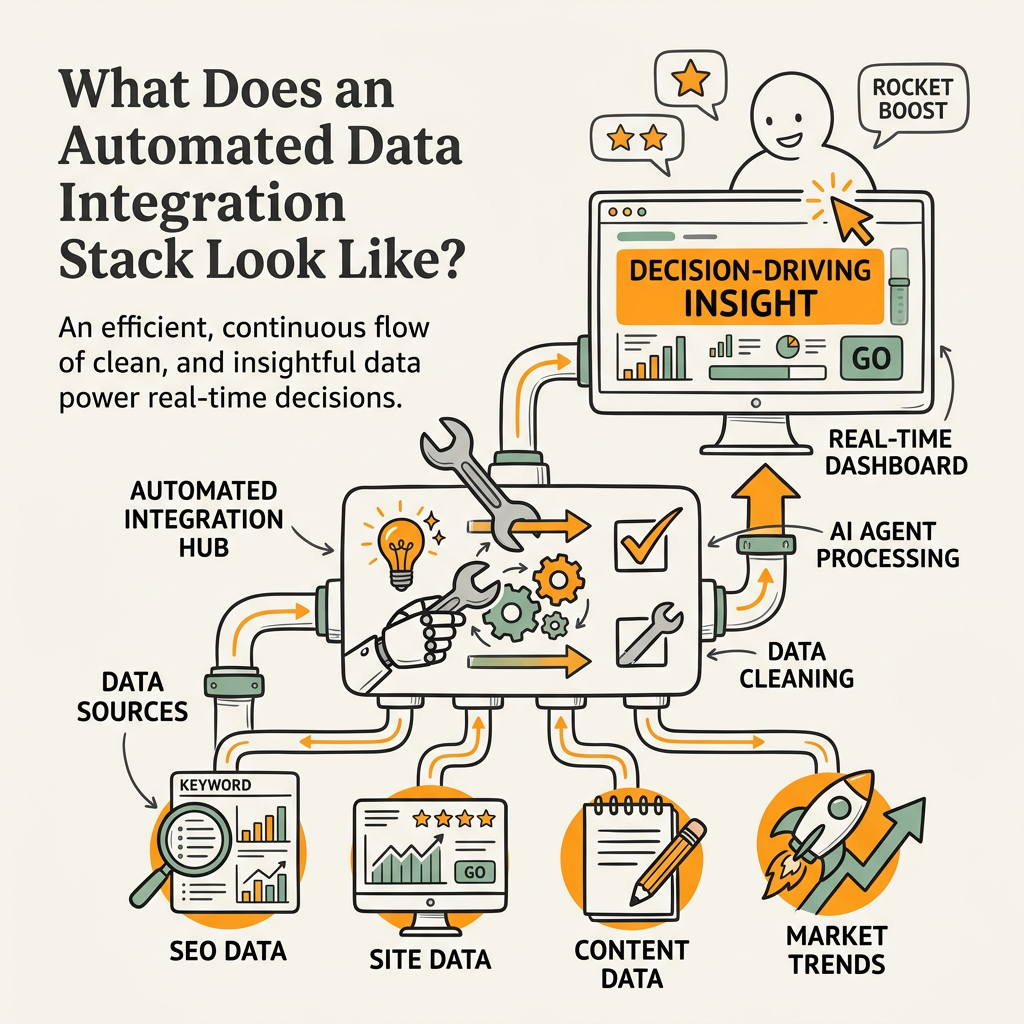
What Does an Automated Data Integration Stack Look Like?
Real-time dashboards require live data connections, not manual exports and copy-paste workflows. If you're building dashboards manually, you're guaranteed to lose freshness and introduce errors. The only way to keep a live dashboard updated is through API integrations that pull data continuously. A proper stack connects your rank tracker, Google Search Console, Google Analytics 4, CMS, and business intelligence tool into a single source of truth. When one system updates, your dashboard reflects it within minutes. This is fundamental to modern SEO strategy that combines manual optimization with AI-powered automation.
Core Integrations Every Dashboard Needs
Start with these five essential integrations:
- Google Search Console API for impressions, clicks, average position, and CTR. This data is authoritative and updates daily.
- GA4 API for organic traffic sessions, conversion data, and engagement metrics.
- Rank tracker API (whether Semrush, Ahrefs, SEMrush, or SE Ranking) to pull keyword positions, visibility scores, and ranking changes.
- CMS API to track publication dates, article updates, and content velocity.
- Backlink tool (Link Explorer, Backlink Checker, or equivalent) to monitor domain authority and backlink growth.
These five integrations form the backbone of a real-time dashboard.
Choosing a Dashboard Platform for API Integration
Most teams use one of three approaches: build a custom dashboard with a BI tool like Looker Studio or Tableau, use a pre-built SEO dashboard like Jottler's autonomous SEO platform, or hire a developer to create a bespoke solution. Looker Studio and Tableau excel at flexibility but require manual connector setup and don't come with SEO-specific templates. Pre-built SEO dashboards automate data integration and include pre-configured alerts, saving setup time. Custom solutions are expensive but offer maximum control. For most growing teams, a pre-built platform with strong API integrations is the fastest path to a working real-time dashboard.
Handling Data Latency and Sync Issues
Understand that "real-time" doesn't mean instantaneous. Google Search Console data updates daily, not hourly. Rank tracker data typically updates once per day. GA4 data arrives with a 24–48 hour lag. Your dashboard reflects these delays. Document the latency for each data source so your team doesn't act on stale data. Set up automated data health checks—alerts that fire if a data source hasn't updated in 24 hours. A missing data update often signals an integration break (API quota exceeded, authentication token expired) that needs immediate attention. The more integrations you have, the higher the chance one breaks. Use monitoring to catch breaks before your team notices the gap.
How Do You Structure Dashboards for Different Stakeholders?
One dashboard for everyone is no dashboard for anyone. A single view either bores executives with too much detail or leaves operators without the data they need. The right approach is role-based views: one dashboard for executives focused on business impact, one for managers focused on operational health, and one for analysts focused on detailed diagnostics. Same underlying data, different lenses. This ensures each stakeholder sees exactly what they need to make their decision faster. Scaling organic traffic without team burnout depends on this layered approach—give each person the view they need and remove everything else.
The Executive Dashboard: Business Outcomes Only
Executives need to answer one question: Is our SEO investment driving revenue? Everything else is detail. An executive dashboard shows three to five KPIs, a trend line for the past quarter, and a forward projection. Add one chart comparing organic revenue to paid and direct channels so they understand SEO's contribution to the mix. Include a simple narrative: "Organic revenue grew 12% this quarter due to 8 new top-10 rankings and improved CTR." Executives should spend 30 seconds reading the dashboard. If it takes longer, you've added too much. No alerts. No drill-downs. Just clarity.
The Manager Dashboard: Weekly Monitoring and Troubleshooting
Managers live in the middle layer. They need to see whether the team is on track to hit KPIs, whether anything is broken, and where to direct effort. A manager dashboard shows the KPIs from the executive view, plus the supporting metrics: traffic trend (daily), ranking distribution, top-performing content, backlink growth, and technical health score. Include a section for active alerts: any ranking drops, traffic anomalies, or technical issues flagged by the system. Managers use this dashboard daily to decide whether to refresh content, investigate a traffic drop, or reallocate resources. This view should take 5–10 minutes to scan and act on.
The Analyst Dashboard: Raw Data and Deep Dives
Analysts need every data point and the freedom to explore. An analyst dashboard includes all metrics from the manager dashboard, plus detailed breakdowns by keyword, by landing page, by query type, and by user segment. Include drill-down capability so analysts can click a traffic anomaly and see which pages drove it. Add ability to filter by date range, device type, location, and other dimensions. Include raw data downloads and export capability. Analysts spend hours in this view, slicing and dicing to find patterns managers miss. This is where the real diagnostic work happens.
Conclusion
Real-time SEO dashboards are no longer optional infrastructure—they're a competitive requirement. Teams that monitor live dashboards with alert thresholds respond to market shifts in hours instead of weeks, capturing ranking opportunities before competitors. The difference compounds: faster response → better rankings → more traffic → more revenue. The structure is simple: choose 3–5 KPIs tied to business outcomes, set alert thresholds for anomalies, automate data integration through APIs, and layer your views by stakeholder role. Start with one real-time metric (organic traffic trend) and one alert (traffic drop exceeding 20%), then expand. The most common mistake is building a dashboard too complex to read. The most successful teams keep it simple, actionable, and aligned to how decisions actually get made. To automate the entire process and ensure your dashboards stay populated with fresh content, start your SEO agent at Jottler's signup page.
FAQs
What's the difference between real-time and historical SEO dashboards?
Real-time dashboards update continuously as data arrives, typically within hours, and excel at detecting anomalies, ranking volatility, and traffic drops as they happen. Historical dashboards are static snapshots taken at scheduled intervals (daily, weekly, monthly) and serve better for trend analysis and performance reviews over longer periods. Real-time dashboards enable fast reaction to market shifts; historical dashboards provide clarity and context for stakeholder reporting. The best approach uses both: real-time monitoring for operators who need speed, historical reports for executives who need perspective.
How many metrics should appear on my main SEO dashboard?
Keep your main dashboard to 3–5 core KPIs tied to business outcomes like organic revenue, conversion rate from organic, and traffic growth. More than five metrics overwhelms decision-making and dilutes focus. Move everything else—diagnostic metrics, raw data, detailed breakdowns—to supporting analyst views. The executive dashboard should be scannable in 30 seconds. If it takes longer, you've added too much. Each metric should answer a business question: Is SEO profitable? Is it growing? Is it efficient? If a metric doesn't answer one of those, remove it.
What alert thresholds should I set for ranking drops and traffic anomalies?
Set different thresholds based on keyword and traffic value. For your top-3 ranking keywords (generating the most traffic), alert on any drop. For keywords ranked 4–10, alert on drops exceeding 3 positions. For keywords 11–30, alert only on drops exceeding 5 positions. For traffic, flag sustained declines when organic traffic is 15–20% below your 90-day rolling average for three consecutive days. Set one primary alert per metric rather than multiple; too many alerts create noise and fatigue. Your thresholds should be tight enough to catch real problems but loose enough to ignore normal daily fluctuations. Test and refine your thresholds quarterly based on false-positive rates.