Setting Up SEO Dashboards That Save Hours Weekly
Most marketing teams spend 5 to 10+ hours every week manually compiling SEO reports from scattered sources. Google Analytics data here, search console numbers there, rank tracking tools elsewhere. When 46.98% of all website traffic comes from organic search, this fragmented reporting workflow becomes unsustainable. Real-time SEO dashboards solve this. Teams using automated dashboards reduce manual reporting by 40% and detect performance issues 2x faster than those relying on static monthly reports. Here's how to set up dashboards that actually save hours every week instead of consuming them.
Key Takeaways
- Automated SEO dashboards cut manual reporting time by 40% and improve campaign turnaround by 35% (DAXRM, 2025).
- Real-time dashboards detect ranking drops and technical issues 2x faster than monthly reports, enabling faster optimization response.
- Teams save 5-10+ hours weekly once data sources are connected and automated refresh schedules are configured.
Quick Setup Checklist
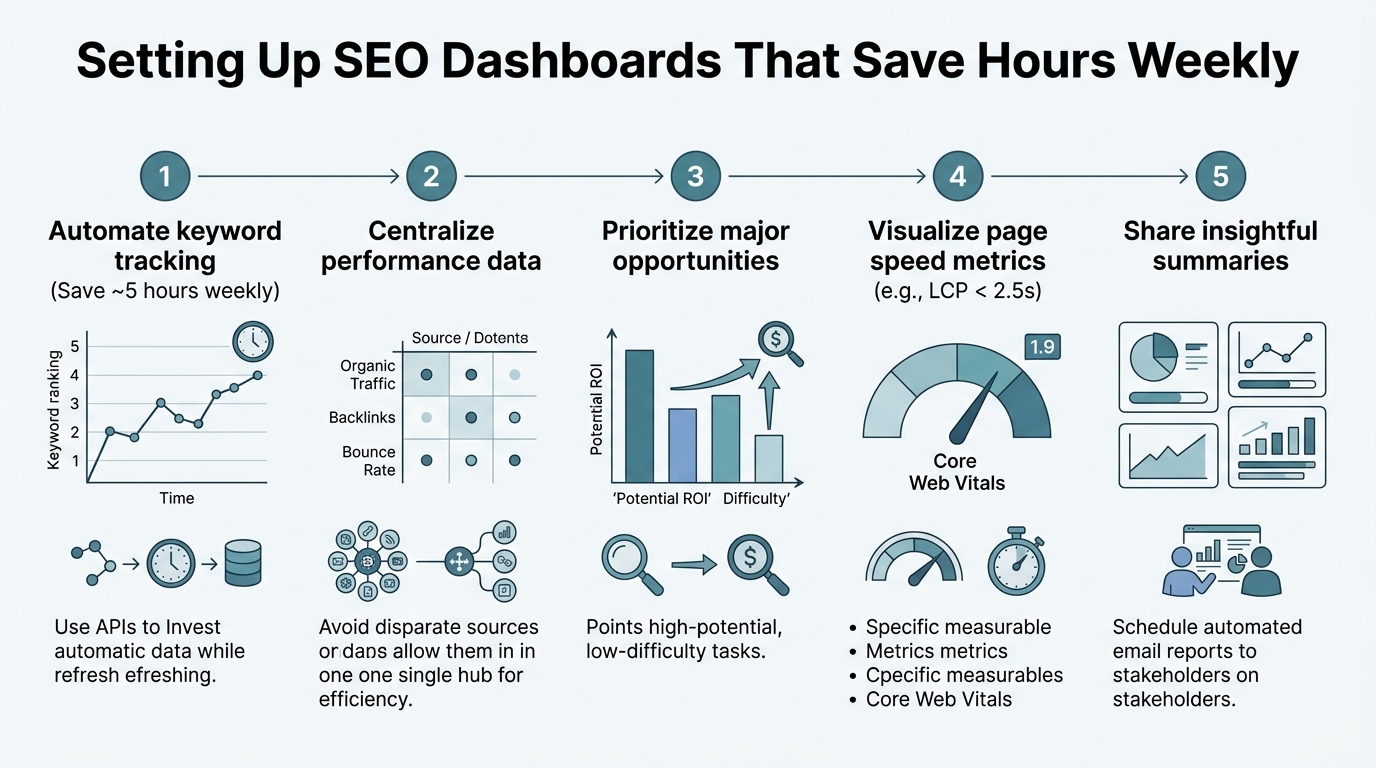
- Connect your data sources once: Link Google Analytics 4, Search Console, rank tracking, and backlink tools via API to eliminate manual exports.
- Define your core metrics: Focus on organic traffic, keyword performance, conversions, and Core Web Vitals—not every metric available.
- Automate refreshes and alerts: Set dashboards to pull data on schedule and notify you of significant changes in real time.
- Build for your audience: Create separate views for executives, marketing teams, and clients—each optimized for their decision-making needs.
- Integrate with your workflow: Connect dashboards to your CMS, content calendar, and task management so insights drive action directly.
Define Your Dashboard's Core Purpose and Audience
Before connecting any data sources, clarify what your dashboard is for and who will use it. 91% of marketers report that SEO has a positive impact on business goals, yet many struggle to articulate that impact to stakeholders. An SEO dashboard without a clear purpose becomes another tab no one visits. Start by asking: Are you tracking performance for internal optimization, client reporting, executive oversight, or all three?
"The difference between a good dashboard and a great one isn't more data—it's clarity about who needs what decision-making information and when they need it." — Marketing Operations Leader, Fortune 500 SaaS
Identify Your Primary Stakeholders and Their Needs
Different roles need different dashboards. An SEO analyst wants granular keyword data, technical metrics, and trend analysis. A marketing director wants traffic impact and revenue contribution. A C-level executive wants bottom-line business metrics. Rather than building one dashboard to rule them all, design focused views for each group. Your analyst dashboard might include search volume trends, rank position changes, and on-page optimization gaps. Your executive dashboard shows organic traffic growth, click-through rate improvements, and estimated revenue impact. Your client dashboard emphasizes transparency: what improved, why it improved, and what's coming next. This specificity is what turns dashboards from reporting tools into decision-making tools. Tools like Improvado and others now offer role-based dashboard views as standard, which accelerates this alignment.
Map Your Business Goals to Metrics
Vanity metrics sink dashboards. A 25% increase in impressions means nothing if rankings aren't holding or traffic isn't flowing. Map your SEO dashboard directly to business outcomes: sales, leads, or customer acquisition cost. If your goal is revenue growth through organic search, your core metrics are organic traffic volume, conversion rate, and average order value—not just keyword rankings. If your goal is brand visibility, track branded search volume, share of voice in your category, and SERP feature rankings (featured snippets, People Also Ask, knowledge panels). This linkage forces you to ask whether your dashboard is informing profitable decisions, not just tracking metrics.
How Should You Select Your Core Metrics?
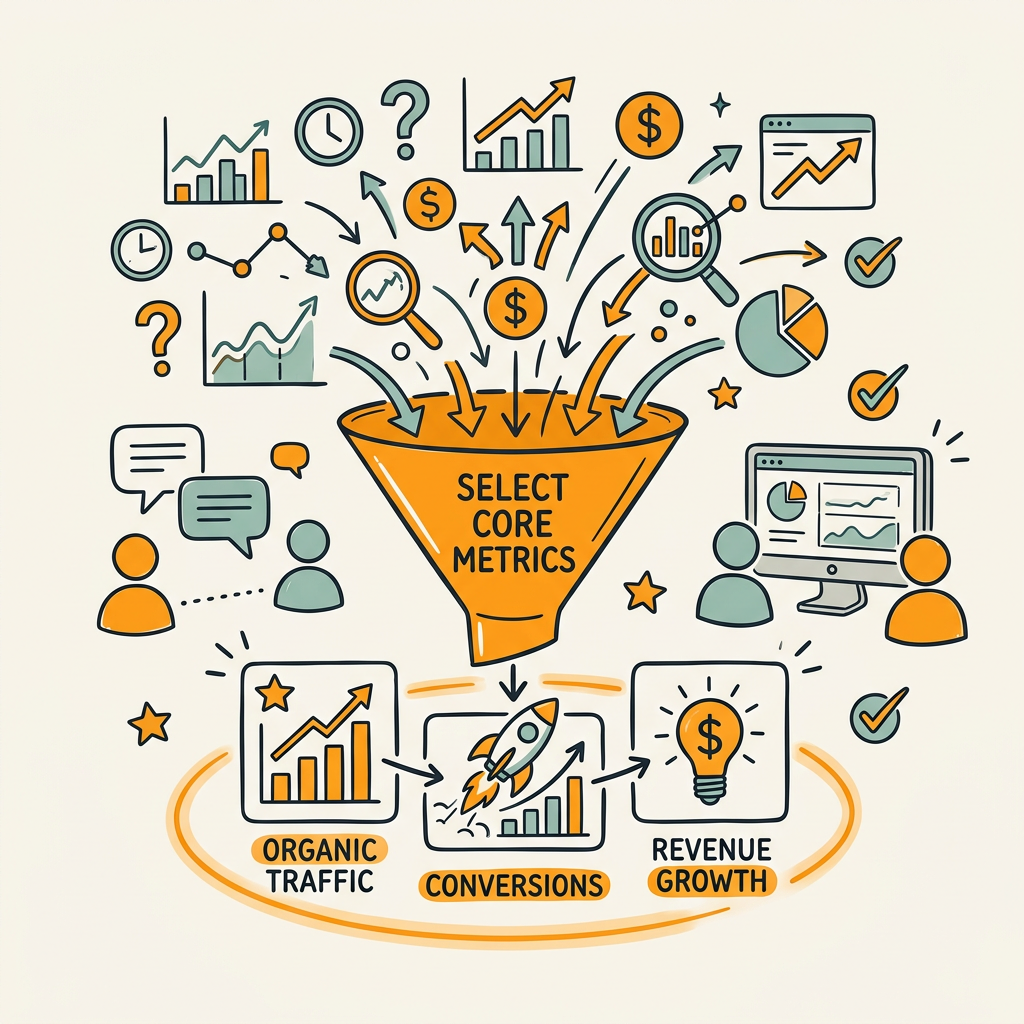
Dashboards fail when they try to display everything. 91% of marketers leverage automated reporting and analytics, yet many still overcomplicate their dashboards with 30+ metrics that create noise instead of clarity. The best dashboards typically show 5 to 8 primary metrics plus 2 to 3 secondary metrics for drill-down analysis. Your core set should answer one question: "Is our SEO strategy working?"
Essential Metrics That Drive SEO Decisions
Start with these five core metrics. First, organic traffic volume—the total sessions from organic search. This connects directly to revenue potential. Second, keyword rankings for your target keywords in your top 5 target positions (the difference between position 1 at 39.8% click-through rate and position 3 at 10.2% is material). Third, organic conversion rate—sessions that become leads or customers. Fourth, average pages per session and bounce rate for engagement quality. Fifth, Core Web Vitals compliance (Largest Contentful Paint, First Input Delay, Cumulative Layout Shift) because they directly affect ranking and user experience. These five metrics fit on a single dashboard screen and answer whether your SEO is growing traffic, ranking for the right keywords, and converting visitors. When you're scaling organic traffic without constant manual work, having these core metrics visible in your dashboard ensures that new content is contributing to measurable outcomes from day one.
Secondary Metrics for Deeper Analysis
Once your core five are locked in, add secondary metrics as drill-down detail. Consider tracking these additional data points:
- Keyword ranking distribution (top 3, 4-10, 11-20 position bands)
- Technical SEO health (index coverage, crawl errors, page speed issues)
- Backlink profile monitoring (domain authority trends, links from authority sources)
- Click-through rate by position (meta descriptions and title tag performance)
- Organic traffic by page and device (identifying your best-performing content)
- Conversion funnel metrics (sessions to leads to customers by traffic source)
These aren't your top dashboard, but they're one click away when you need to investigate performance dips. The goal is progressive disclosure: high-level summary first, detailed analysis on demand.
What Data Sources Should You Connect First?
Time spent configuring data sources is time saved forever. 92% of marketers now use automation for data analysis and reporting, yet many teams still rely on manual data pulling from multiple platforms. The order matters. Connect the sources that represent the largest portion of your workflow friction first. For most teams, that's Google Analytics 4, followed by Google Search Console, then rank tracking.
"Once we automated our data connections, we stopped having arguments about what the numbers actually were. One source of truth made decision-making faster and removed reporting as a bottleneck." — Head of Growth, B2B SaaS Company
Google Analytics 4 Integration via GA4 Connector
Google Analytics 4 is your authoritative source for traffic volume, user behavior, and conversion data. Most modern dashboard platforms (Looker Studio, Supermetrics, Improvado, DashThis) support direct GA4 connectors via API. The setup is straightforward: authenticate your GA4 property, select your view, and pull organic traffic by landing page, keyword intent, and device. The advantage: real-time or near-real-time data refresh every few hours. The caveat: GA4 no longer shows keyword-level data (Google withholds this for privacy reasons), so you'll need Search Console to fill that gap. Set up a scheduled daily refresh for your GA4 connector so your organic traffic metrics are never more than 24 hours behind. Most platforms cache this efficiently and won't slow your dashboard.
Google Search Console API for Ranking and CTR Data
Search Console is where Google tells you which keywords your pages rank for, what position they hold, and how often they appear in search results. The official Search Console API now supports direct integration with most dashboard tools. Connect it second because it's foundational: without Search Console data, you can't track whether your SEO improvements are translating to ranking gains. Pull metrics like average position by page, impressions, and clicks. The Search Console connector typically refreshes daily and covers up to 16 months of historical data, so you can see seasonal patterns and month-over-month trends. One pro tip: filter your Search Console data by target keyword clusters. This helps you segment performance by topic instead of looking at hundreds of keywords in one massive list.
Rank Tracking Platform API
Search Console shows your average position, but it doesn't track granular rank changes by day or hour, and it doesn't show your rankings across different devices or geographic regions. Rank tracking tools (SEMrush, Ahrefs, SE Ranking, Moz) fill this gap. They track your top target keywords daily and alert you to ranking drops. Connect your rank tracker via API (most offer Looker Studio, Tableau, or native dashboard connectors) and pull keyword rankings, rank position trends, and keyword difficulty. This is optional if you only care about Search Console data, but essential if you're optimizing specific high-value keywords. The trade-off: rank tracking tools cost $50-500/month depending on keyword count, but the daily granularity and alert capability make them worth the investment if SEO is core to your business.
How Do You Automate Data Refresh and Alerts?
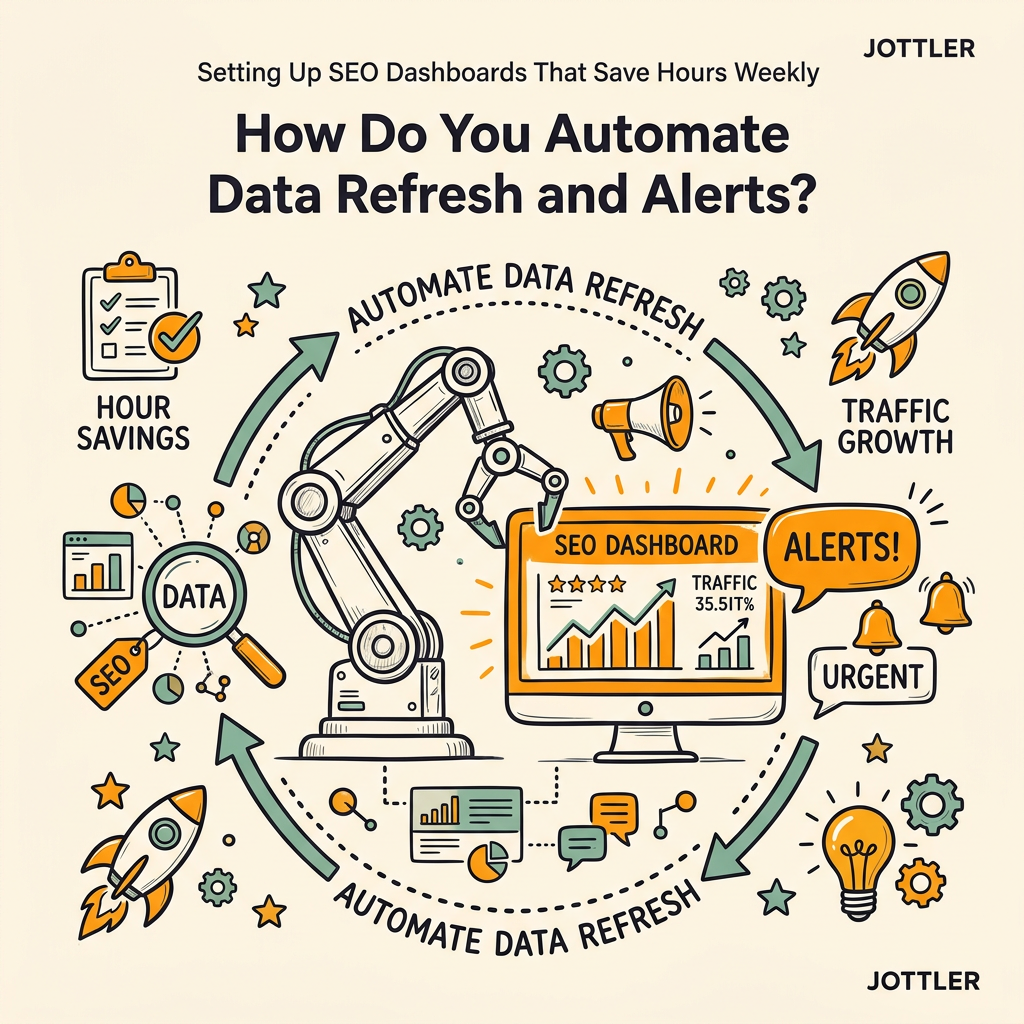
A dashboard is only as useful as its freshness. Stale data leads to stale decisions. Teams that set up automated refresh schedules and alerts save hours because they stop manually logging in to check whether performance changed. Agencies using real-time dashboards improve campaign turnaround by 35%, largely because they spot issues the moment they happen instead of discovering them weeks later in a monthly report.
Schedule Automatic Refresh Frequency and Time Windows
The right refresh frequency depends on your role and traffic volume. For internal optimization, a daily refresh overnight (after most daily traffic has settled) is ideal. For executive dashboards, weekly refresh on Monday morning is often sufficient. For client dashboards, weekly refresh just before your weekly reporting window prevents you from seeing stale data mid-week and having to explain discrepancies. Most modern dashboard platforms support cron-style scheduling. Set your primary refresh for 2-4 AM (off-peak hours) when data is most fresh and API rate limits are lowest. Set a secondary refresh at noon if you're monitoring high-velocity keyword movements. Avoid hourly refreshes unless you're running active paid campaigns—it's overhead for minimal new information and will eventually hit API rate limits. Test your refresh schedule for a week, check that data loads completely each time, then automate it and stop thinking about it.
Configure Alerts for Critical Metric Changes
The power of automated dashboards isn't just visibility—it's alerts. When a core metric drops significantly, your dashboard should notify you before you discover it manually. Set up alerts for these critical changes:
- Organic traffic drops >20% month-over-month (signals ranking loss or technical issue)
- Ranking drops >3 positions for your top 20 keywords
- Core Web Vitals threshold violations
- Crawl error spikes indicating indexation problems
- New high-value keyword opportunities ranking in top 20
Alerts go to Slack, email, or your project management tool so the right person sees it immediately. The goal isn't to panic at every 5% dip; it's to catch material changes that need investigation within hours, not days. Most dashboard tools and rank trackers now offer this natively. Content marketing automation platforms now integrate directly with these dashboard alerts, so performance data from published articles flows directly into your monitoring workflow alongside your other SEO metrics.
Build Automated Report Distribution Schedules
Once your dashboard is populated with fresh data, automate its distribution. Most teams generate weekly or monthly reports for stakeholders. Instead of manually building these reports, configure your dashboard tool to email a snapshot to your manager, clients, or leadership team on a set schedule. Reportz and similar platforms allow you to schedule dashboard exports as PDF or email snapshots, and some even embed live dashboard links. Set up a weekly report delivery at 9 AM every Monday, with one week's worth of data lagging (so Monday's report covers last week). This eliminates the manual step of "compile the report" and replaces it with "check if it arrived in inboxes"—automation at its finest.
Which Dashboard Platform Should You Build Your Dashboard In?
You have four main categories: Google Looker Studio (free), native platform dashboards (from rank trackers and SEO tools), dedicated reporting platforms (DashThis, Reportr, Improvado), and internal dashboard solutions (building your own in Google Sheets with Supermetrics, or in a BI tool like Tableau). The best choice depends on your technical comfort, budget, and integration needs.
| Platform | Best For | Setup Time | Cost | Automation Strength |
|---|---|---|---|---|
| Google Looker Studio | Free, simple dashboards for internal teams | 2-4 hours | Free | Native Google Sheets/Analytics connectors; limited alert capability |
| DashThis / Reportr | Client reporting and agency workflows | 4-8 hours | $50-200/month | White-labeling, scheduled email delivery, alert automation |
| Native Rank Tracker Dashboards (SEMrush, Ahrefs, SE Ranking) | Keyword ranking focus with minimal setup | 1-2 hours | Included in tool subscription | Built-in keyword alerts and trend tracking |
| Jottler | Autonomous SEO content performance tracking and content strategy integration | Minutes with pre-built templates | Starts at $29/month | Automatic content performance tracking, keyword research integration, publishing monitoring |
| Custom BI Tools (Tableau, Power BI) | Enterprise organizations with complex data models | 40+ hours | $70-2000/month | Maximum customization; requires technical team |
For most growing companies, Looker Studio or a dedicated reporting platform like DashThis is the sweet spot: free or low-cost, quick to set up, and powerful enough to automate reporting. If you're an agency managing multiple client sites, invest in a purpose-built reporting platform with white-labeling and scheduled distribution. If you're an in-house team at a growing company focused on organic traffic compounding, automated SEO best practices increasingly include dashboard integration where your content publishing, keyword research, and performance metrics all feed into a unified monitoring view. This ensures your dashboard doesn't just track old content—it monitors the performance of new high-quality SEO content as it publishes and ranks, automatically feeding performance data back into your content strategy.
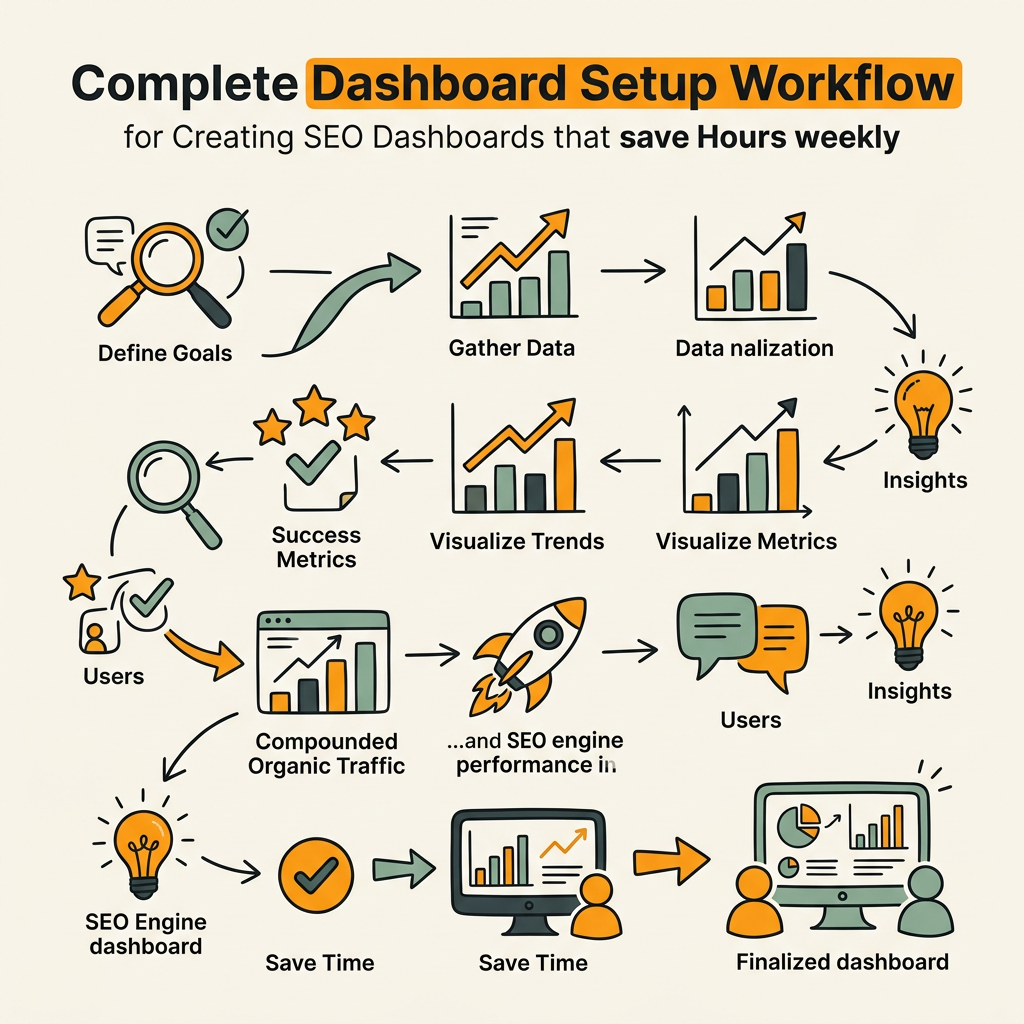
What's the Complete Dashboard Setup Workflow?
From zero to automated takes 8 to 20 hours depending on your platform choice and data source complexity. Here's the step-by-step workflow most teams follow successfully.
Step 1: Choose Your Platform and Create Your Account
Spend 30 minutes deciding: Looker Studio (free, simpler), a reporting platform (small upfront fee, faster setup), or a native rank tracker dashboard. Sign up and complete the onboarding. This is a 15-minute task, not a bottleneck. Don't spend hours comparing platforms; start with what your team knows or what comes recommended by peers.
Step 2: Authenticate and Connect Your First Data Source
Authenticate Google Analytics 4 first. Most platforms have a "connect GA4" button that walks you through OAuth authentication. You'll grant the dashboard access to your GA4 properties and select which ones you want to pull data from. This takes 10-15 minutes. Test that data is flowing: check that the dashboard shows sessions from the past 30 days. If data is missing, verify that your GA4 property is tracking organic search traffic correctly.
Step 3: Connect Google Search Console
Repeat the authentication process for Search Console. Your dashboard should now show impressions, clicks, and average position by landing page. These two data sources combined give you a complete picture of traffic and rankings in about 30 minutes of setup time.
Step 4: Build Your Core Metric Cards
In your dashboard builder, create cards for your five core metrics: organic traffic, keyword rankings (for top 20 keywords), conversion rate, pages per session, and Core Web Vitals score. Each card should show the current period value, the prior period value, and the percent change. This is where your dashboard starts looking like a dashboard and not just raw data. Spend 2-3 hours on this step to get the layout and formatting right. Once you have a template, rebuilding for different audience segments takes 30 minutes each.
Step 5: Add Secondary Drill-Down Metrics
Create a second page of your dashboard with lower-level metrics: keyword ranking distribution, technical SEO scores, backlink growth, and traffic by page. These don't need the same visual polish as your core metrics—they're for analysis, not executive summary. Spend 1-2 hours here, then move on. Perfectionism on secondary metrics is a time sink.
Step 6: Configure Automatic Refresh and Testing
Set up your data refresh schedule in your dashboard platform. Most allow you to define a frequency (daily, weekly) and time window. Set your first refresh for tomorrow at 3 AM. Check back in the afternoon to verify data loaded. Once you confirm data loaded successfully, your refreshes will continue on schedule forever—no further action needed. This takes 15 minutes to configure.
Step 7: Create Dashboard Views for Each Audience
Duplicate your core dashboard and customize it for each stakeholder: analyst view (detailed metrics, secondary tabs), director view (three-card summary: traffic, rankings, conversions), and client view (impact story: traffic growth, keyword improvements, next steps). 30 minutes per view customization using your core dashboard as a template.
Step 8: Set Up Alerts and Automations
Configure alerts for your critical metrics: organic traffic down >20% month-over-month, ranking drop >3 positions for top keywords, Core Web Vitals failures. Connect to Slack or email. Configure scheduled email distribution of your weekly/monthly reports. 30 minutes here, and you're done. All future insights flow to your team automatically.
What Common Mistakes Should You Avoid?
Building dashboards is straightforward, but there are patterns that teams repeat that slow adoption and dilute impact. Avoiding these saves hours of rework.
Overcrowding Your Core Dashboard
The temptation is to show every metric you track. Resist it. A dashboard with 50 cards teaches nothing—it's information overload. Constrain your primary dashboard to 5 to 8 metrics. If someone needs more detail, they dig deeper. This design discipline forces you to answer: "What does success look like?" If you can't define it in eight metrics, your SEO strategy isn't clear enough. Tools and dashboards won't fix that—strategy clarity will.
Forgetting to Validate Your Data Sources
Before publishing your dashboard to stakeholders, spend 15 minutes validating that your data is clean. Cross-check your GA4 organic traffic number against what Google Search Console reports (they'll be close but not identical due to filtering differences). Verify that your rank tracking tool is tracking the right keywords. Spot-check a few metrics manually in the source tools. Confirming data accuracy before wide distribution prevents embarrassing "the numbers are wrong" conversations later and builds trust in your dashboards as a source of truth.
Setting Refresh Frequency Too High
Hourly refreshes feel like you're staying on top of things, but they're unnecessary overhead and will eventually hit API rate limits. Daily refreshes (overnight) are sufficient for internal use and client reporting. Unless you're actively managing a paid campaign or handling a crisis SEO situation, stick to daily. This also keeps your API costs lower if you're using a platform that charges per API call.
Not Connecting Dashboards to Action
A dashboard that surfaces a problem but doesn't connect to who fixes it is just a report. Your dashboard should link to: your content calendar (so traffic drops on a page point you directly to the article), your rank tracking tool (so ranking losses point you to optimization opportunities), and your task management system (so critical alerts create action items). Creating an SEO content plan that ships requires this kind of integration between planning, publishing, and monitoring so that dashboard insights directly inform your next content priorities.
Conclusion
Setting up an SEO dashboard that actually saves hours weekly boils down to three decisions: clarity on what you're measuring and why, automation of data refresh so you never manually pull reports again, and the discipline to show only what matters. Teams using real-time dashboards reduce manual reporting by 40% and detect problems 2x faster than monthly reporters, creating a competitive advantage in how quickly they can respond to SEO changes. The infrastructure takes 8 to 20 hours to build, but it repays that investment within weeks—saving 5 to 10+ hours monthly on reporting alone, not counting the faster optimization response those alerts enable. Most growing companies leave this investment off their roadmap because building a dashboard feels like a "nice to have" project. It's not. It's foundational to scaling SEO impact without scaling team headcount. Start with your core five metrics, connect your data sources, and automate the rest. Once your dashboard is live and feeding alerts to your team, you'll wonder how you ever managed SEO reporting without it.
FAQs
How much time does an SEO dashboard actually save?
Most teams save between 5 to 10+ hours per week once their dashboard is configured and running automatically. The savings come from eliminating manual data exports, spreadsheet updates, and manual report assembly. One team managed five client sites and was spending 15 hours per week on reporting—their automated dashboard cut that to 2 hours per week for monitoring and analysis. The biggest savings are in the first month; after that, the dashboard runs on its own and you're just responding to alerts and interpreting trends. If your team currently spends 5 hours weekly on reporting work, a dashboard will recoup its setup time investment within four weeks.
Can I build an SEO dashboard with Google Sheets?
Yes, you can build a functional SEO dashboard in Google Sheets using Supermetrics' Google Sheets connector to pull data from GA4, Search Console, and rank tracking tools. The setup takes 3-4 hours and costs nothing beyond Supermetrics ($99-299/month depending on tier). The trade-off: Google Sheets dashboards require more manual updating than dedicated dashboard platforms, and alert capability is limited. Use Google Sheets if you want maximum customization for a small internal team. Use a dedicated reporting platform (DashThis, Reportr, Improvado) if you need white-labeling, scheduled email distribution, or client reporting. Use Looker Studio if you want free, native Google Analytics integration with minimal setup friction.
What's the difference between a dashboard and a report?
A report is a static document (PDF or email) generated at a point in time and sent to stakeholders on a schedule. A dashboard is a living interface that updates continuously and allows exploration. Real-time dashboards detect performance changes 2x faster than monthly reports because you see problems as they emerge, not weeks later. Dashboards also enable faster decision-making: if a ranking drops, you click into the dashboard to see which pages were affected, what changed, and where to focus optimization efforts. Reports are excellent for executive summaries and client proof-of-value, but dashboards are better for internal optimization because they're always current and always accessible. The best approach: use dashboards for internal team management and optimization, and use automated report generation (snapshots of your dashboard) for client and executive communication on a regular schedule.