Site Speed, Core Web Vitals, and Rankings: What Actually Matters
Core Web Vitals now drive a measurable ranking advantage in 2026. While they account for only 1–3% of Google's direct algorithm weight, sites with "Good" scores rank on average 12 positions higher than technically equivalent content on "Poor" scoring sites. Yet the real story isn't about ranking algorithms—it's about revenue. Every 100ms of page delay costs roughly 1% in conversion rates, meaning slow sites leak money directly to competitors. Here's how to evaluate what actually matters for your rankings and bottom line.
Key Takeaways
- Core Web Vitals account for 1–3% of direct ranking weight but act as a tie-breaker when content quality is equal (Rankeo, 2026)
- Only 48% of mobile pages pass all three CWV thresholds; failing them now triggers site-wide aggregation penalties affecting entire domains
- Every 100ms improvement in load time recovers roughly 1% in conversions; a $10M revenue site gains ~$100K from a 100ms fix (Tenet, 2026)
- Understanding What Core Web Vitals Actually Do: They measure real-world user experience but function as ranking gatekeepers, not primary drivers.
- How Site-Wide Aggregation Changes the Game: Google now evaluates entire domains, not individual pages, meaning one slow template can drag down rankings across your site.
- The True Business Case for Speed: Conversion impact far exceeds ranking benefits—site speed is a direct revenue multiplier.
- INP, LCP, and CLS Explained: Each metric measures different aspects of user experience with tightened thresholds in 2026.
- Practical Optimization Paths: Prioritize the metrics that bleed the most traffic for your specific site type.
Why Core Web Vitals Matter More in 2026 Than You Think
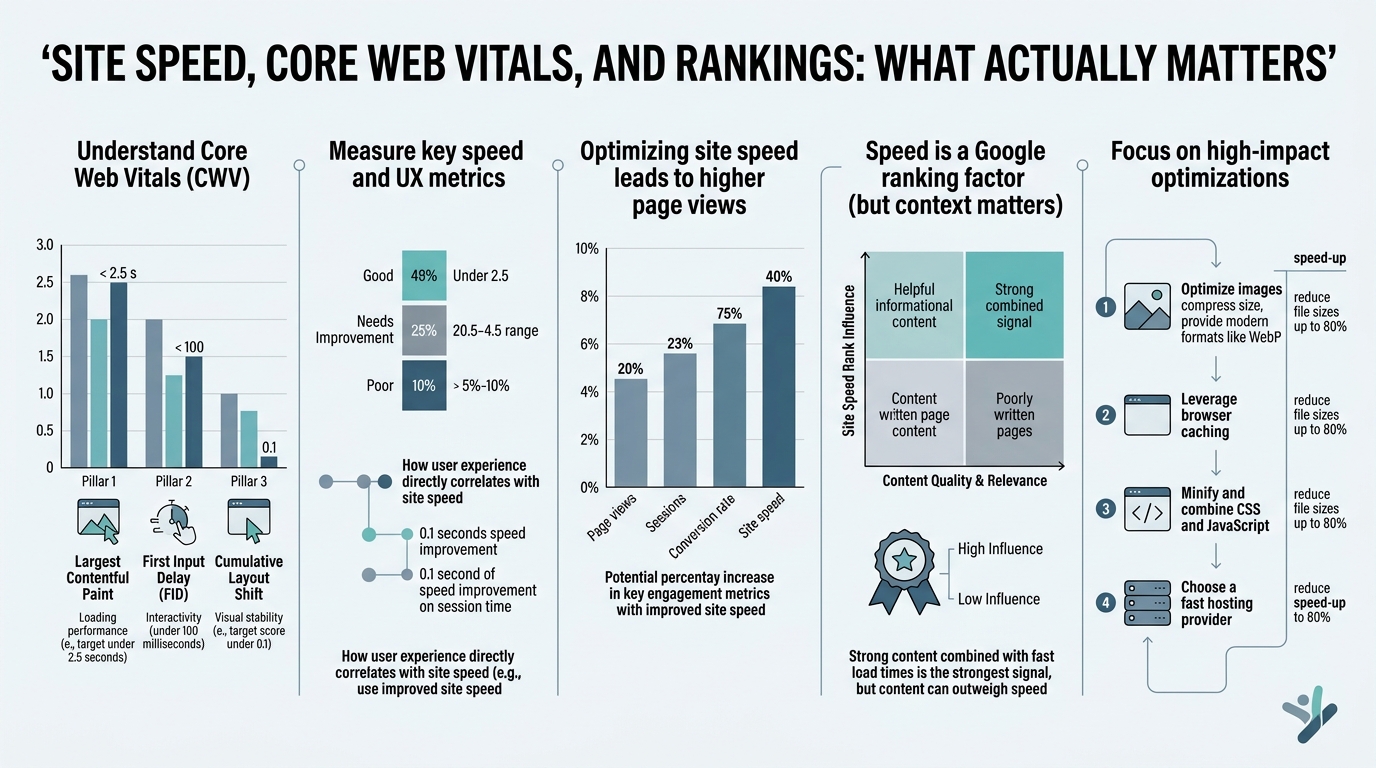
The narrative around Core Web Vitals has shifted dramatically. In 2026, sites with "Good" Core Web Vitals scores rank approximately 12 positions higher than sites with "Poor" scores when content quality is equivalent. But here's the catch: they're a ranking tie-breaker, not a primary ranking signal.
"Your entire domain's ranking potential is now constrained by your slowest-loading template. A single slow blog archive or product category page can suppress organic visibility across your entire property."
Google's March 2026 algorithm update introduced site-wide aggregation. Previously, you could have slow pages buried in your site while keeping your homepage blazingly fast. Now, your entire domain's ranking potential is constrained by your slowest-loading template. A single slow blog archive or product category page can suppress organic visibility across your entire property. Sites affected by this shift lost 20–35% of their organic traffic in the weeks following the update.
- Direct Algorithm Weight: Core Web Vitals = 1–3% of ranking factors when viewed in isolation.
- Effective Weight (With Page Experience): When bundled into "Page Experience," they represent approximately 42% of ranking weight for competitive keywords.
- Real-World Impact: Passing CWV doesn't guarantee ranking gains, but failing them guarantees losses.
The Myth of the Optional Speed Update
You've likely heard someone claim Core Web Vitals no longer matter. That's false. The claim stems from outdated 2023 analysis. Tighter thresholds rolled out in March 2026, and Google now aggregates scores site-wide instead of per-page. This makes speed more consequential, not less. Additionally, AI-driven search engines (Google SGE, Bing Chat, and emerging competitors) now filter slow pages before users ever see them. Building AI-powered SEO strategies now means optimizing for these algorithmic filters, not just traditional ranking positions.
Why Ranking Position Underestimates the True Cost
Most content focuses on ranking position as the outcome metric. This misses the real damage. A site losing 12 ranking positions likely loses far more than 12% of its organic traffic—it could lose 40–60% depending on the keyword's commercial intent. But that's still secondary to what happens with conversions. Slow pages don't just rank poorly; they hemorrhage users who bounce before they even land.
Understanding the Three Core Web Vitals Metrics
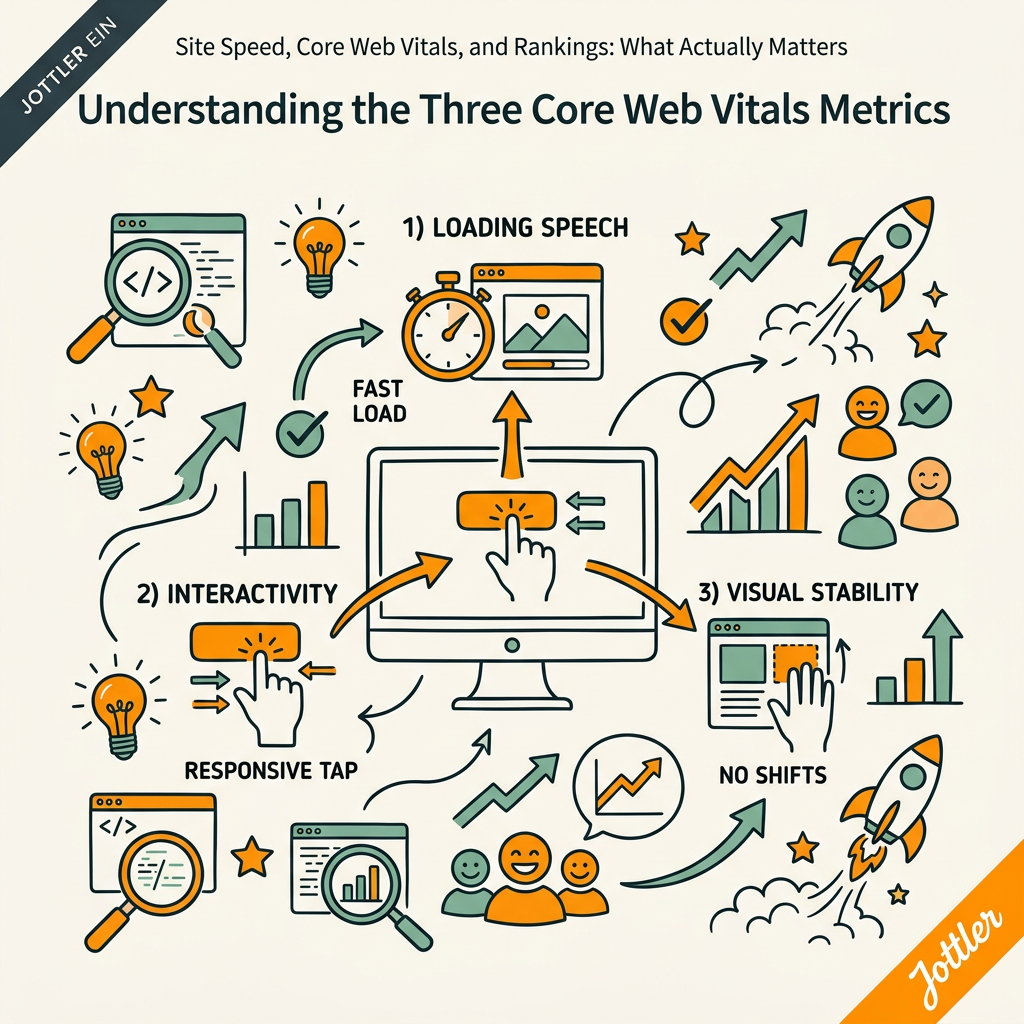
Core Web Vitals measure three distinct user experience problems. Each maps to a specific type of user frustration, and each requires different optimization approaches. Understanding this distinction is critical because optimizing all three at once requires a prioritization strategy. When implementing SEO automation tools, many teams focus on content first but overlook these performance metrics entirely.
Largest Contentful Paint: The Loading Problem
LCP measures how long it takes for the largest content element on the page to become visible and interactive to the user. This is the most directly visible metric—it's what users perceive as "load time." In 2026, the "Good" threshold dropped from 2.5 seconds to 2.0 seconds. Sites failing this now see measurable ranking drops of 2–4 positions on competitive queries.
"Sites achieving LCP under 2.5 seconds show a 23% higher conversion rate compared to those above 4 seconds, making this the highest-impact metric for both user experience and revenue recovery."
LCP is driven by four core factors: server response time (TTFB), render-blocking JavaScript, image optimization, and lazy-loading strategy. For most sites, improving LCP yields the highest ROI because it's visible to users and directly impacts both rankings and conversions. Sites achieving LCP under 2.5 seconds show a 23% higher conversion rate compared to those above 4 seconds.
- Optimization Focus: Image format optimization (AVIF, WebP), JavaScript deferring, CDN deployment, and server response time reduction.
- Measurement Tool: PageSpeed Insights, Web Vitals JavaScript library, Google Search Console CWV report.
- Impact on Conversions: Highest of the three metrics—LCP improvements translate directly to revenue recovery.
Interaction to Next Paint: The Responsiveness Problem
INP replaced First Input Delay (FID) in 2024 and became the primary interactivity metric in 2026. Instead of measuring just the first interaction, INP captures the longest interaction delay during a user's entire session. This makes it both more comprehensive and more stringent than its predecessor. The "Good" threshold is <150 milliseconds, and failure triggers measurable ranking penalties averaging 0.8 positions.
INP measures the time between a user interaction (click, tap, keyboard input) and the browser's response. A slow INP feels like a broken site—buttons don't respond, forms lag, animations stutter. For content sites, INP is often a secondary concern, but for SaaS platforms, e-commerce sites, and interactive tools, it's critical. Breaking long JavaScript tasks, using Web Workers for heavy computation, and optimizing event handlers are the primary levers.
- Common INP Failures: Unoptimized click handlers, render-blocking JavaScript, heavy animations without GPU acceleration, main-thread congestion.
- Measurement Tool: Web Vitals library (real-user monitoring), PageSpeed Insights, Chrome DevTools.
- Optimization Complexity: High—requires deep JavaScript knowledge. Offloading to dedicated tools or frameworks is common.
Cumulative Layout Shift: The Stability Problem
CLS measures unexpected movement of page elements during the loading process. It's the metric most directly tied to user frustration—when you're about to click a button and the entire page shifts, bumping your click into an advertisement instead. The threshold remains <0.1 and is the easiest of the three metrics to pass. Approximately 80.9% of mobile pages currently pass CLS.
CLS is almost always a quick win. Reserve space for images and videos using CSS aspect-ratio boxes, avoid inserting content above the fold during load, and use CSS `transform` for animations instead of `top/left` properties. Most CLS failures stem from lazy-loaded images, auto-inserted ads, or dynamic content insertion. Fixing these typically takes hours, not weeks.
- Quick Wins: CSS aspect-ratio reserves, removing auto-ads from above-the-fold, deferring embed insertion.
- Measurement Tool: PageSpeed Insights, Web Vitals library, Google Search Console.
- Impact on Rankings: Lower than LCP and INP but still a ranking factor when it's the differentiator between sites.
How Page Speed Directly Impacts Your Revenue
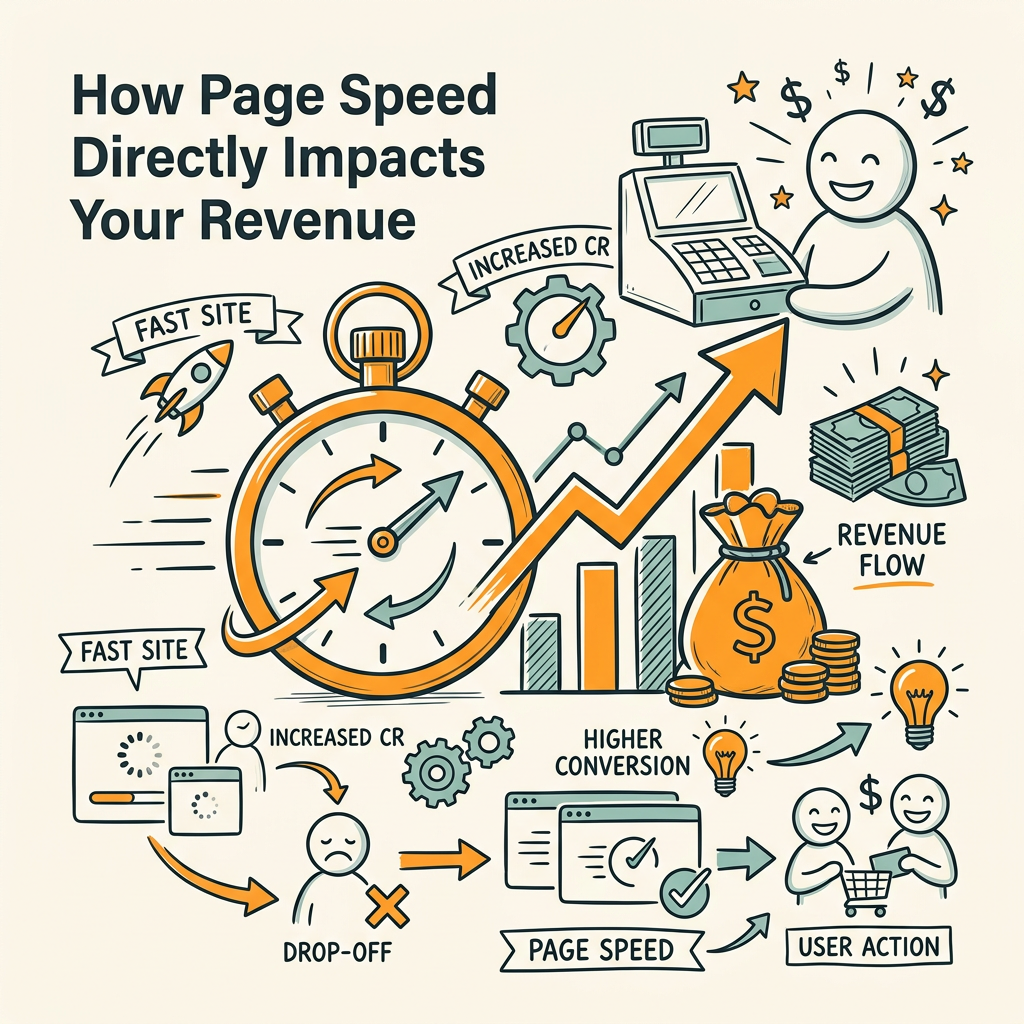
Ranking is one outcome. Revenue is what matters. The relationship between site speed and conversion rates is nearly linear in 2026, and the financial impact is staggering. Slow websites cost retail businesses $2.6 billion in lost sales annually. For a typical $10M revenue site, every 100ms of improvement recovers approximately $100K in annual revenue.
"A 1-second load time maintains a roughly 40% conversion rate. Add 1 more second (2-second total load), and conversions drop to 34%. Beyond 3 seconds, user abandonment accelerates dramatically—53% of mobile users leave a page if it takes longer than 3 seconds to load."
This isn't theoretical. Real-world data shows that a 1-second load time maintains a roughly 40% conversion rate. Add 1 more second (2-second total load), and conversions drop to 34%. A 3-second load triggers a 29% conversion rate. Beyond 3 seconds, user abandonment accelerates dramatically. 53% of mobile users leave a page if it takes longer than 3 seconds to load.
The Conversion Impact by Load Time
The data is precise. Every 100ms of additional load time costs roughly 1% in conversion rates, and the effect is multiplicative. A site loading in 5 seconds has a 5x lower conversion rate than a 1-second site. A 10-second site is effectively dead—conversions collapse to 8% of baseline.
For mobile specifically, the sensitivity is even higher. A 1-second delay on mobile reduces conversions by up to 20% (compared to 7% on desktop). This is why mobile optimization is non-negotiable. Users have reduced their waiting tolerance from 3 seconds in 2020 to less than 1.5 seconds in 2026. When automating content marketing, teams must remember that delivery speed matters as much as content quality.
| Load Time | Conversion Rate (Typical Benchmark) | Revenue Multiplier vs. 1s Load | Mobile Impact |
|---|---|---|---|
| 1 second | ~40% | 1.0x (Baseline) | Baseline |
| 2 seconds | ~34% | 0.85x (-15%) | -20% (mobile users) |
| 3 seconds | ~29% | 0.73x (-27%) | 53% abandonment rate |
| 5 seconds | ~20-25% | 0.50-0.63x (-37 to -50%) | Critical abandonment |
| 10 seconds | ~8% | 0.20x (-80%) | Functionally unusable |
Calculating Your Speed Recovery Opportunity
If you're a founder or marketing leader at a scaling company, here's the calculation: Take your annual revenue. Multiply by 0.01 for every 100ms of delay above baseline. For a $10M revenue site running at 2.5 seconds (500ms above the 2.0s "Good" threshold), the formula is: $10M × (5 × 0.01) = $500K in annualized revenue recovery available from speed optimization alone.
This is why organizations obsess over Core Web Vitals in 2026. It's not because Google demanded it. It's because the math is brutal. A small team optimizing speed can recover hundreds of thousands in revenue with no sales or marketing spend—just technical leverage.
How Speed Affects AI Search Visibility
Beyond traditional Google rankings, AI-driven search engines now use page speed as a citation signal. Fast, stable pages are cited more frequently in AI-generated summaries. Slow pages are filtered out entirely. This creates a dual penalty: lower traditional rankings plus lower AI search visibility. The compounding effect is larger than either penalty alone.
Site-Wide Aggregation and the Domain Penalty Risk
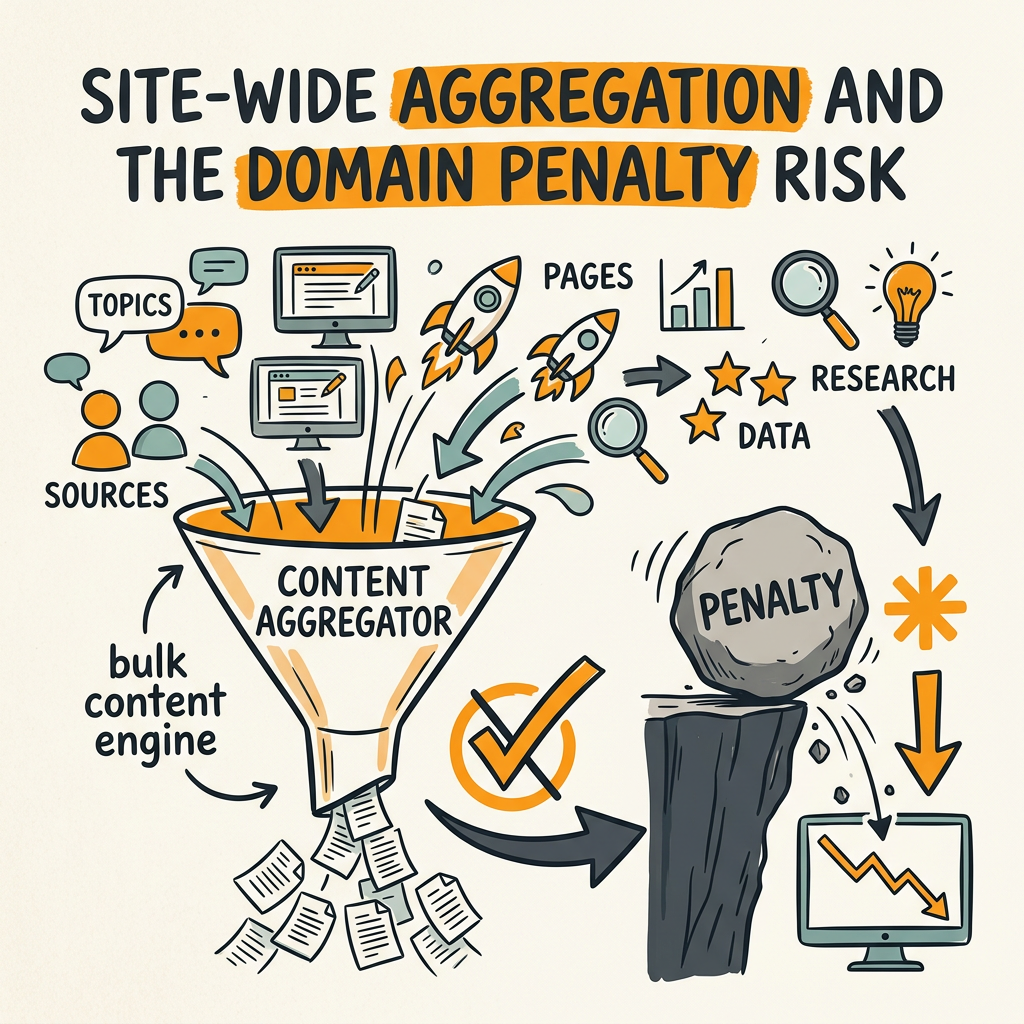
Google's March 2026 update introduced the most consequential shift in Core Web Vitals enforcement since their inception: site-wide aggregation. Previously, you could have a blazingly fast homepage and slow blog posts buried 10 pages deep. Your homepage would rank well, and the slow pages would rank poorly. Now, Google evaluates your entire site's CWV performance and uses that aggregate score to evaluate all pages on your domain.
The implication is profound. A single slow template type—blog archives, category pages, product listings, or old legacy pages—can suppress rankings for your entire site. Teams saw traffic drops of 20–35% in the weeks following the update. The fix isn't optional—it's survival.
Diagnosing Your Site's Aggregation Risk
Start in Google Search Console. Pull the Core Web Vitals report and filter by page type or template. Look for outliers—pages with "Poor" or "Needs Improvement" scores. If your slow pages represent more than 10–15% of your indexed pages, you're at aggregate risk. If your slowest pages are your most important (homepages, top landing pages), you're at critical risk.
The fix isn't to improve averages. It's to eliminate the outliers. Prioritize pages in this order: (1) High-traffic pages, (2) High-converting pages, (3) Pages linked from your homepage, (4) Indexed but low-traffic pages. Slow legacy pages that barely get traffic can be deindexed, archived, or consolidated to reduce your aggregate score penalty.
Template Audit Framework
Most sites have 5–15 core page templates. Create a matrix: template name, number of pages using it, average Core Web Vitals score, traffic percentage, conversion percentage. Focus optimization effort on templates that are (a) slow and (b) high-volume or high-impact. A slow blog archive template affecting 500 pages is higher priority than a slow template affecting 10 pages, even if those 10 pages get more traffic individually.
Optimization Strategy for Founders and Marketing Teams
You don't have a team of performance engineers. You need a prioritization framework that works with limited resources. Here's the approach that compounds over time: audit once, optimize templates (not pages), then monitor. This systematic approach mirrors how professional SEO content plans tackle scaling challenges—through systematic template improvements rather than one-off fixes.
Phase 1: Baseline Audit (Week 1)
Use Google Search Console's Core Web Vitals report as your baseline. Export all data. Calculate your aggregate score (percentage of pages passing all three metrics). Set a target: 75% of pages passing by month 3, 90% by month 6. This forces prioritization instead of perfection.
Identify your three slowest page template types. These are your leverage points. Improving one template can fix hundreds of pages at once.
Phase 2: High-Impact Fixes (Weeks 2–4)
Focus on LCP improvements first—they yield the highest ROI for both rankings and conversions. Typical high-impact fixes include:
- Image Optimization: Convert to next-gen formats (AVIF, WebP), add lazy loading, set explicit dimensions to prevent layout shift.
- JavaScript Deferring: Defer non-critical scripts, minify and bundle remaining code, use dynamic imports for below-the-fold content.
- Content Delivery Network: Cache static assets globally. CloudFlare, Vercel, and similar services often reduce TTFB by 40–60% out of the box.
- Server Response Time: Aim for <100ms TTFB. Evaluate database query optimization, caching layers, and server capacity.
Phase 3: Sustainable Monitoring (Ongoing)
Set up automated monitoring. Use tools to track CWV scores monthly. When a page falls below "Good," you'll know immediately. Catch regressions before they affect aggregate scores.
Document what worked. If image optimization improved LCP by 300ms, make that your standard for all future content. If deferring a specific script library helped, add that to your deployment checklist. Small, documented wins compound into organizational capability.
Balancing Speed Optimization with Broader SEO Goals
Speed matters, but it's not your only ranking factor. Content quality, keyword relevance, and backlinks still matter more in most competitive niches. The issue is that slow sites are invisible to compete on those factors at all—they're filtered out before ranking algorithms even consider them. Scaling organic traffic without burnout requires balancing technical foundations with strategic content investment.
Think of Core Web Vitals as a table-stakes metric. You need to pass to get to the real competition. Once you do, speed becomes a tie-breaker, not a differentiator. This is why the advice "obsess over Core Web Vitals above all else" is incomplete. It should be "pass Core Web Vitals, then obsess over content, relevance, and authority."
The Hierarchy of Competitive Advantage
For most content-driven sites, the ranking impact hierarchy is: (1) Content quality and topical authority (60%), (2) Backlinks and domain authority (20%), (3) Technical SEO including speed (15%), (4) User experience and engagement (5%). Speed optimization often yields outsized returns early because so many sites are failing—it's a low-hanging fruit. But it's not the long-term moat.
For e-commerce and conversion-focused sites, the hierarchy shifts. Speed becomes a primary factor because it directly impacts the bottom line. A 100ms improvement on a high-traffic e-commerce site is worth thousands of dollars. For a low-traffic blog, it might be worth hundreds. Know your site type and optimize accordingly.
Content-First Sites vs. Conversion-First Sites
A publication or SaaS blog can tolerate slower speed if content is exceptional and unique. A product page cannot. Allocate resources based on your revenue model. If you make money from conversions, speed is non-negotiable and should get 40–50% of your technical resource budget. If you make money from ads or sponsorships, speed matters less but is still worth optimizing because it affects rankings and user satisfaction.
Conclusion
Core Web Vitals matter in 2026 more than they did in 2024, but not for the reason most people think. They're a gatekeeper metric. Failing them guarantees traffic loss due to site-wide aggregation penalties. But passing them doesn't guarantee ranking gains—it just removes the penalty, positioning you to compete on content and authority.
The real story is business impact. Every 100ms of speed improvement recovers approximately 1% in conversions, and for a $10M revenue business, that's worth $100K annually. Organizations that treat speed as a technical exercise miss the revenue angle. Those that treat it as a revenue lever prioritize the right optimizations.
Start with a baseline audit of your Core Web Vitals in Google Search Console. Identify your three slowest page template types. Optimize them in order of traffic and commercial impact. Monitor monthly. Document what works. Let those wins compound. This is how busy founders and marketing teams scale without burning out—by letting technical leverage do the heavy lifting.
Start your SEO agent to monitor Core Web Vitals across your entire site and identify optimization opportunities automatically. Jottler's autonomous approach means you fix the highest-impact issues first, without needing a dedicated performance engineer on payroll.
FAQs
What is a good Core Web Vitals score for SEO?
A "Good" score in 2026 means: LCP under 2.0 seconds, INP under 150 milliseconds, and CLS under 0.1. Pages passing all three metrics across the 75th percentile are considered "Good." Your overall site performance is evaluated through site-wide aggregation, so the goal is to get at least 75–80% of your pages into "Good" status. Below that threshold, you'll see aggregate ranking penalties affecting your entire domain, regardless of individual page strength.
How much do Core Web Vitals actually affect rankings compared to content?
Core Web Vitals represent 1–3% of direct ranking weight when viewed in isolation, but they function as a gatekeeper. Failing them doesn't automatically rank you low—it prevents good content from ranking well. In competitive niches with equivalent content quality, sites with "Good" Core Web Vitals rank approximately 12 positions higher than "Poor" sites. Think of it as a filter that removes technically broken sites before ranking algorithms evaluate content quality, relevance, and authority.
Should I prioritize LCP, INP, or CLS for optimization?
Prioritize LCP first—it has the highest combined impact on rankings and conversion rates. Every 100ms improvement in LCP recovers roughly 1% in conversions, making it the highest-ROI optimization. CLS is usually the easiest to pass (80% of sites pass it), so tackle it second for a quick win. INP is the hardest to optimize but affects fewer sites critically; focus on it if you have interactive elements or heavy JavaScript. For most content sites, fixing LCP solves 60–70% of your Core Web Vitals issues.