Building Custom SEO Dashboards for Monthly Reporting
Most marketing teams spend 4–6 hours per week manually compiling SEO metrics across spreadsheets, Google Analytics, Google Search Console, and scattered reporting tools. With 58.5% of searches now producing zero clicks to websites and AI Overviews triggering on roughly 50% of queries, traditional dashboard metrics like raw rankings and impressions no longer tell the full performance story. The fix? A custom SEO dashboard that connects visibility, engagement, and revenue in one automated, monthly-ready view.
Key Takeaways
- Approximately 58.5% of searches produce zero clicks, making engagement and conversion data more critical than impressions (Whitehat-seo, 2026)
- Modern dashboards now track organic-attributed revenue and AI visibility alongside traditional rankings and SERP features
- Effective monthly reports use a four-tier framework covering business outcomes, traffic visibility, rankings, and AI share of voice
- Define Your Core Metrics: Move beyond domain authority and keyword positions to organic traffic by intent, engagement rate, and revenue attribution.
- Connect Your Data Sources: Integrate Google Analytics 4, Google Search Console, CRM data, and technical SEO crawlers into a single unified view.
- Build Automated Workflows: Establish daily data pulls and weekly calculations so monthly reports populate themselves without manual effort.
- Segment Traffic by Intent: Track informational, navigational, and transactional traffic separately to understand which content segments drive revenue.
- Include AI Visibility Metrics: Monitor branded search trends and AI citation frequency to track performance in AI-driven search environments.
Why Traditional SEO Dashboards Fail Your Monthly Reporting
The reason most teams struggle with monthly SEO reporting isn't a lack of datait's that traditional dashboards focus on vanity metrics. Strategyc research shows that dashboards emphasizing rankings and impressions are systematically misleading because they ignore the shift toward AI-driven search and zero-click results. Executives see "2,400 impressions," feel encouraged, and then discover the site generated zero leads from organic.
The problem compounds when your dashboard doesn't integrate your CRM or business outcomes. Organic traffic becomes a vanity metric rather than a revenue channel. To fix this, custom dashboards must be built around a four-tier framework that layers business outcomes (revenue, leads), traffic visibility (sessions by intent, impressions, CTR), rankings and features (SERP visibility, featured snippets), and AI visibility metrics (branded search growth, AI citations).
The Cost of Manual Reporting
Teams relying on manual spreadsheets and disconnected tools burn time every month. A typical workflow involves exporting data from Google Analytics, pulling search console metrics separately, cross-referencing CRM data for conversions, calculating month-over-month changes in Excel, and then formatting everything into a presentation. This process takes 4–6 hours per report and introduces errors at every handoff. When data is stale or fragmented, stakeholders question findings, requiring rework and delays.
Custom dashboards eliminate this friction by automating data ingestion and calculations. Once configured, they populate themselves daily, ready for monthly export or client sharing without a single manual step. This automation directly supports the content marketing ROI measurement process that drives executive confidence.
Why Rankings No Longer Drive Executive Decisions
The shift away from keyword rankings as a primary KPI reflects a fundamental change in search behavior. When 50% of queries trigger AI Overviews, users see an answer immediately without clicking to a website. Rankings still matterthey determine if your site appears in the generating source set for AI answersbut position #1 doesn't guarantee traffic anymore. This reality means dashboards must track visibility across all search surfaces, including AI citations, featured snippets, and knowledge panels, not just traditional organic rankings.
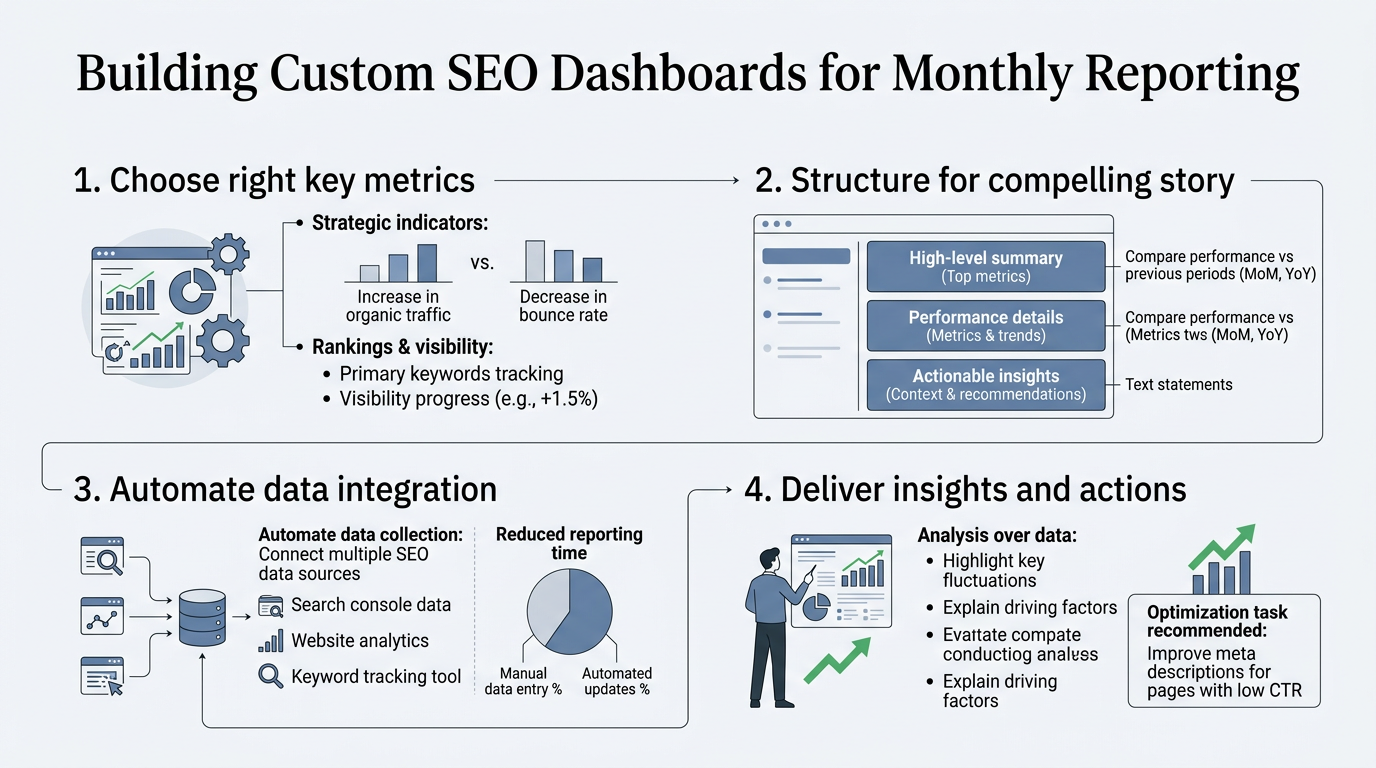
How to Select and Define Your Core Metrics
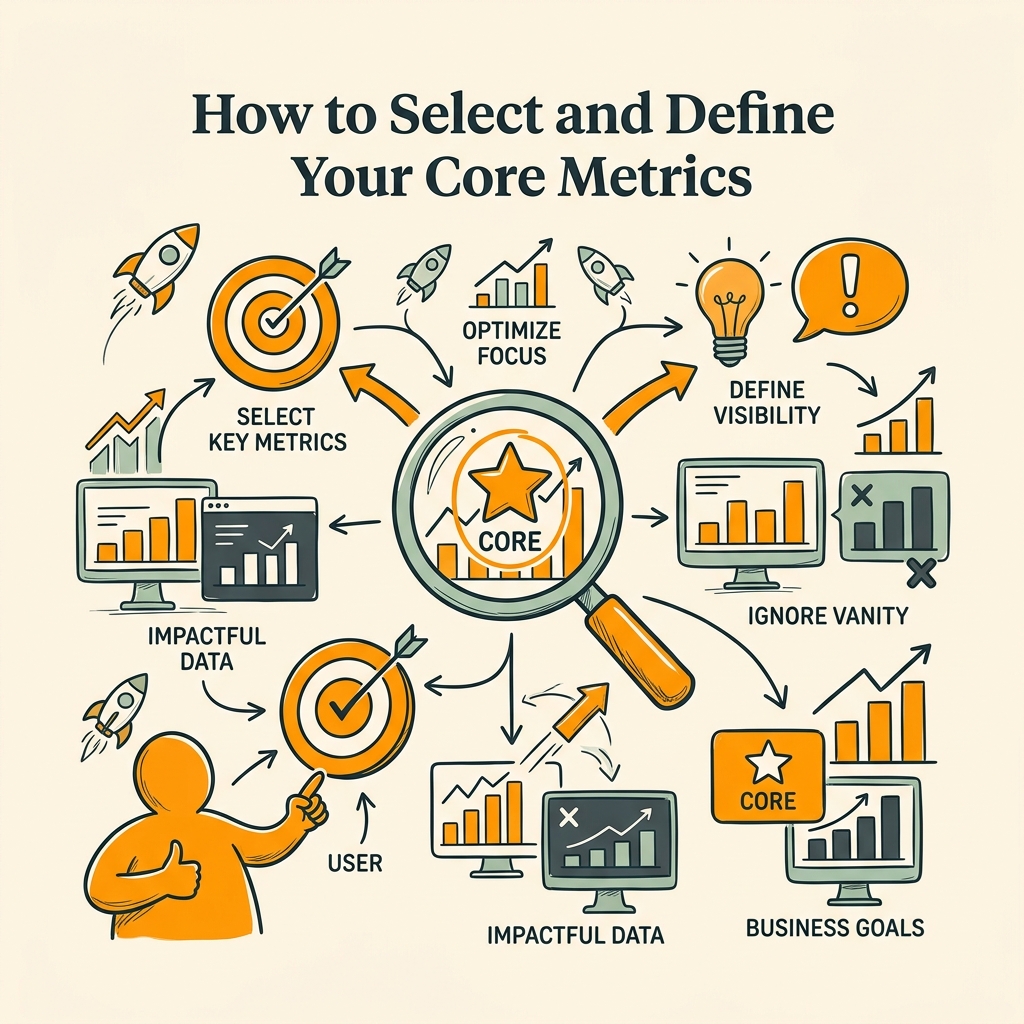
Building a custom dashboard begins with choosing metrics that actually drive decisions. IndexCraft's SEO reporting guide recommends structuring dashboards around four tiers: business outcomes first, then traffic and visibility, then rankings and features, then AI visibility. Each tier answers a specific question your stakeholders care about. Understanding this structure is foundational to any SEO automation workflow.
Tier 1: Business Outcomes (Revenue, Leads, CAC)
Start here. Every dashboard should open with the metrics that justify SEO investment: organic-attributed revenue, organic leads, and customer acquisition cost (CAC) from organic channels. These require GA4 integration with your CRMGoogle Analytics 4's conversion tracking and ecommerce event trackingbut they're non-negotiable for executive buy-in. If you can't tie organic traffic to revenue, your dashboard will be ignored. Calculate this by attributing conversions logged in GA4 to the organic channel, then multiply by average deal value or revenue per lead. Many teams also track traffic cost-equivalent: the amount they would spend on paid search to acquire that same organic traffic volume.
Tier 2: Traffic and Visibility (Sessions by Intent, Impressions, CTR)
The second tier breaks down organic traffic by intent segment (informational, navigational, transactional) and tracks engagement. Informational content attracts awareness-stage visitors; transactional content drives conversions. Dashboards should show organic sessions by intent, average session duration, and engaged sessions (sessions longer than 10 seconds with a conversion or 2+ pageviews). Also track impressions from Google Search Console and click-through rate (CTR) separatelyimpressions reveal if your site appears for your target keywords, while CTR shows if your title and meta description compel clicks.
Tier 3: Rankings and Technical Health (Visibility Score, Core Web Vitals, Index Ratio)
Traditional keyword rankings are useful but should be aggregated into a visibility score rather than listed individually. Modern dashboards replace long keyword tracking lists with a single aggregate visibility percentage that measures your share of total search visibility in your market. Pair this with technical health metrics: Core Web Vitals (LCP, FID, CLS), crawl coverage, index ratio (indexed pages versus submitted pages), and site speed. Capston notes that poor Core Web Vitals scores correlate directly with higher bounce rates and lower conversion potential, so technical health drives traffic quality.
Tier 4: AI Visibility (Branded Search Growth, AI Citations)
The newest and most critical layer tracks your presence in AI-driven search. Monitor branded search volume month-over-month from Google Search Console (a proxy for brand authority driven by SEO success), AI Share of Voice (how often your content appears in AI answers), and AI referral traffic from tools like Perplexity and ChatGPT. These metrics are emerging KPIs in 2026 because AI is steadily replacing traditional search and becoming a content distribution channel in its own right.
Connecting Your Data Sources Without Broken Pipelines
A custom dashboard is only as good as its data pipeline. Every metric you've defined needs a source system. Building the connectors is where most projects stallteams try to manually pull data, use generic APIs, or rely on brittle third-party integrations that break monthly. The solution is to architect your dashboard around stable, well-documented APIs from Google Analytics 4, Google Search Console, and your CRM, then use either a BI tool (Looker Studio, Tableau, Power BI) or a specialized SEO reporting platform to centralize everything.
Google Analytics 4 as Your Traffic and Revenue Source
GA4 is non-negotiable for modern SEO dashboards because it's the only free source of traffic segmentation by channel, intent, and conversion. Set up GA4 properties to track organic traffic by content topic (use custom dimensions to label pages by intent), engaged sessions (use the built-in engagement metric), and conversions by funnel stage. Connect your ecommerce or SaaS transaction data so GA4 calculates revenue attribution automatically. Most teams pair GA4 with a data warehouse (Google BigQuery is free up to 1 TB/month) to pull 13 months of historical data for trend analysis instead of relying on the 28-day GA4 UI limit.
Google Search Console for Impressions, CTR, and Rankings
GSC provides the only official source for impressions and CTR. Export your Search Console data into a spreadsheet or a BI tool to track monthly trends. Set up queries to segment impressions by keyword intent (create a filter list for transactional keywords, informational keywords, etc.) so you can see which keyword categories drive engagement. Use GSC's "Search results" report to identify high-impression, low-CTR keywords where improved title tags or meta descriptions could lift traffic, and low-impression, high-CTR keywords where ranking improvements would have highest impact.
CRM Integration for Lead Attribution
Connecting your CRM (Salesforce, HubSpot, Pipedrive, etc.) to your dashboard closes the loop between traffic and revenue. Use GA4's ecommerce connector or Conversion API to send lead and deal data back to Google. Then, in your dashboard, pull CRM API data to show organic leads per month, organic lead value, and organic deals closed. This integration is the single biggest driver of executive confidence in SEO because it proves organic traffic moves revenue.
Technical Crawlers for Index Ratio and Performance
Tools like Screaming Frog, Ahrefs, or SEMrush pull technical health data via their APIs. These crawls should run monthly or bi-weekly, and key metricscrawl errors, index status, Core Web Vitals distribution, and site speedshould feed directly into your dashboard. Most BI tools can ingest these CSVs or API responses and automatically append them to your monthly report.
Building Automated Workflows So Reports Generate Themselves

The real efficiency gain comes from automating the report generation itself. Rather than manually pulling data each month, modern reporting workflows use scheduled data pulls that calculate month-over-month changes and flag anomalies automatically. This is where custom dashboards unlock the most time savings. Implementing content automation tools magnifies this benefit because your traffic metrics improve automatically as new content publishes daily.
Daily Data Pulls via APIs and Scheduled Exports
Set up daily or weekly API calls to fetch the latest data from GA4, GSC, and your CRM. Most BI platforms (Looker Studio, Tableau, Power BI, or dedicated SEO reporting tools) support scheduled refreshes that run overnight, so your dashboard is always current by morning. No manual exports needed. Define SLAs for data freshness: GA4 data is available with a 24-48 hour lag, GSC data refreshes every 3 days, so plan your reporting cadence accordingly.
Month-over-Month and Year-over-Year Calculations
Calculate MoM growth rates and YoY comparisons automatically. Set up dashboard formulas that divide this month's organic revenue by last month's, express it as a percentage, and flag anomalies (e.g., "Growth dropped 25% this monthinvestigate"). These calculated fields should be updated daily so monthly reports simply snapshot the month-end values. When you pair dashboard automation with content production engines that publish 3,000+ word articles daily, your growth metrics compound month-over-month.
Anomaly Detection and Alerts
Set up threshold alerts for key metrics. If organic traffic drops more than 20% in a week, trigger an alert. If ranking visibility declines unexpectedly, flag it. These automated alerts prevent surprises and let you investigate issues quickly rather than discovering them in a monthly report.
Scheduled Report Distribution
Configure your BI tool to automatically export the dashboard as a PDF or send it to stakeholders via email on a set schedule (e.g., first business day of each month). Many platforms support scheduled snapshots with embedded insights and recommendations, so stakeholders see conclusions, not just raw numbers.
Structuring Your Dashboard for Monthly Reporting
How you visually organize your dashboard determines how much executives trust it and how fast they understand it. The best monthly reports follow a pyramid structure: executive summary at the top, supporting details below, and raw data in appendices.
Executive Summary Tab (One Page, Three Insights)
The first thing a stakeholder sees should be: organic revenue this month, organic revenue growth (MoM and YoY), and top takeaway (e.g., "Organic leads grew 18% due to 24% increase in informational content traffic"). Then show a simple chart of 6–12 months of organic revenue trend. Below that, add one key metric that moved the needle (e.g., "Core Web Vitals improved to 'good' range, session duration +12%"). No more than one pageexecutives won't scroll.
Traffic and Engagement Tab
Show organic traffic by intent as a stacked bar chart (informational + navigational + transactional) trended monthly. Include engaged session rate and conversion rate by intent segment. This tab answers: "Which types of content drive the most engaged traffic and conversions?"
Visibility and Rankings Tab
Plot your visibility score (aggregate visibility %) month-over-month. Add a breakdown of featured snippets owned, rankings in top 3 vs. top 10 vs. top 50, and impressions by keyword intent. Include your Core Web Vitals distribution (% pages in "good", "needs improvement", "poor" ranges).
AI Visibility and Brand Tab
Track branded search volume trend (month-over-month growth in branded queries in GSC), brand SERP features (knowledge panels, sitelinks, featured snippets), and estimated AI citations (manually or via tool integrations). This is your forward-looking dashboardAI visibility is the new traffic driver.
Issues and Recommendations Tab
Every report ends with 3–5 prioritized recommendations. Example: "3 high-traffic pages have CTR below 2%; updating meta descriptions could lift traffic 12%." Back each recommendation with data and estimated impact. This actionable layer is what separates reports from dashboardsit drives next month's priorities.
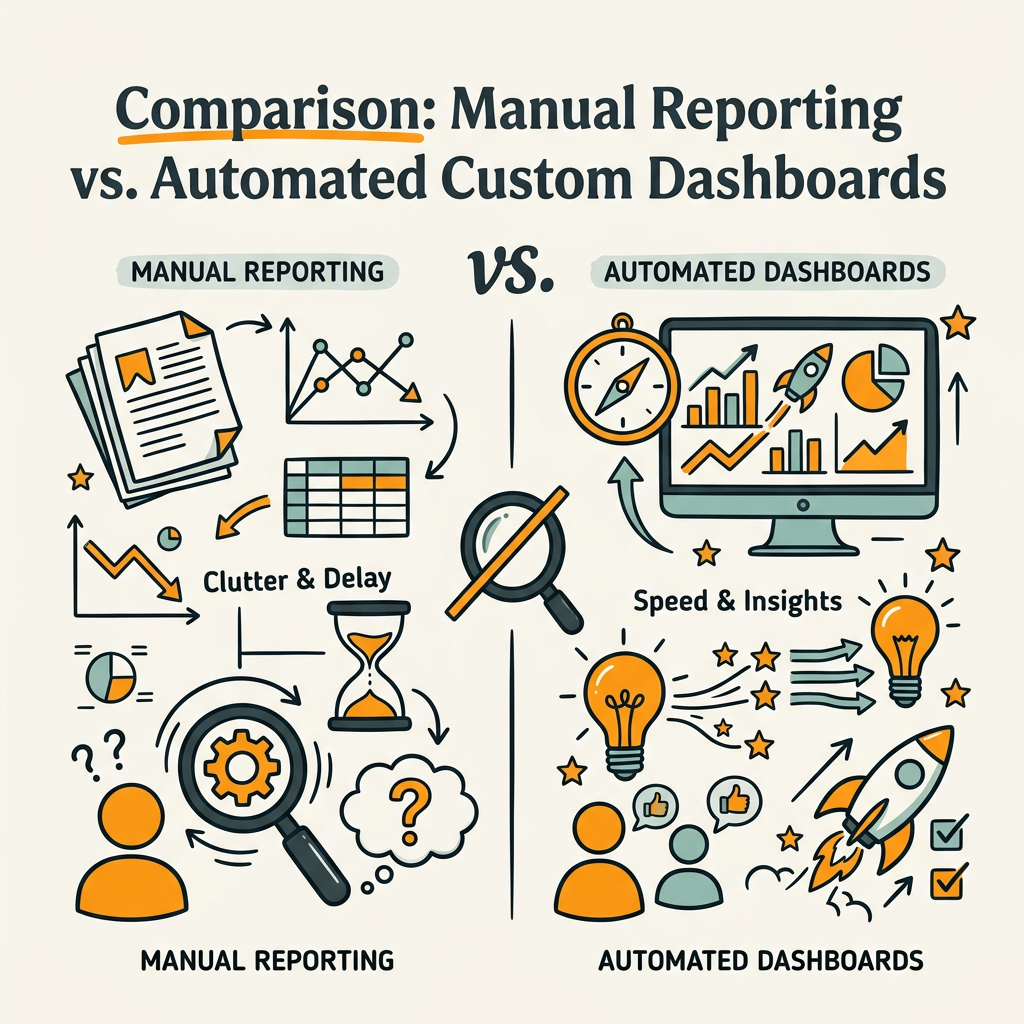
Comparison: Manual Reporting vs. Automated Custom Dashboards
| Aspect | Manual Spreadsheet Reporting | Custom Automated Dashboard | Jottler + Dashboard Integration |
|---|---|---|---|
| Time per Report | 4–6 hours of manual data collection and formatting | 15–30 minutes to export and review | 5 minutes; automatic content flow feeds traffic metrics directly |
| Data Freshness | Stale; limited to data available at report time | Real-time; updates daily | Real-time + automatic content updates that improve tracked metrics |
| Error Risk | High; manual formulas and copy/paste errors | Low; calculations automated | Minimal; data verified through fact-checking pipeline |
| Revenue Insight | Often missing; sales data disconnected | Complete; CRM integrated with organic channel | Complete + accelerated; daily content compounds organic traffic volume |
| Anomaly Detection | Manual; often missed until month-end review | Automated alerts; flagged within 24 hours | Automated + proactive; content optimization responses |
| Stakeholder Confidence | Low; numbers questioned frequently | High; single source of truth | Highest; proven by consistent month-over-month growth |
The comparison reveals why custom dashboards drive executive confidence. They're not just fasterthey're more reliable and forward-looking. When Jottler automates content creation at scale (publishing 3,000+ word articles daily), that content flow feeds directly into your dashboard metrics, creating a compounding organic growth engine rather than isolated monthly reports.
Tackling Common Dashboard Pitfalls
Building a custom dashboard is straightforward in theory but often derails on implementation. Here are the most common pitfalls and how to avoid them.
Metric Overload (Too Many Metrics, No Clarity)
Many teams make their dashboards so comprehensive they become useless. A 50-metric dashboard doesn't drive faster decisionsit creates analysis paralysis. Limit your monthly report to 8–12 core metrics max. The rest belong in appendices or weekly pulse checks. Every metric on the dashboard should answer one of these questions: "Are we growing revenue from organic?", "Is engagement improving?", "Are rankings healthy?", or "Are we visible in AI search?" If a metric doesn't fit, it's clutter.
Missing Revenue Attribution
The single biggest dashboard failure is showing traffic without revenue. If your dashboard doesn't show organic-attributed revenue, leads, or CAC, executives will deprioritize SEO. Always pair traffic metrics with business outcomes. Set up GA4 ecommerce tracking and CRM integration from day one, even if the data is imperfect initiallyget something connected and improve it over time.
Data Disconnects and Manual Workarounds
If your dashboard relies on one person manually downloading a file and pasting it into a spreadsheet weekly, it will fail the moment that person leaves. Invest in API integrations, not manual workarounds. Most platforms have good API documentation; use them. If you're not technical, hire a consultant for one day to set up the pipelineit pays for itself in saved time within a month.
Reporting on Vanity Metrics
Domain authority, raw keyword counts, and individual position rankings belong in SEO team weekly standup, not monthly executive reports. These vanity metrics create false confidence. Focus your monthly dashboard on the four tiers: outcomes, traffic, rankings (aggregated), and AI visibility. That's the only language executives understand.
Conclusion
Custom SEO dashboards transform monthly reporting from a time-consuming manual process into an automated insight engine. By connecting your data sourcesGA4, GSC, CRM, and technical crawlersinto a single view and structuring reports around the four-tier framework (business outcomes, traffic and visibility, rankings and features, AI visibility), you give stakeholders a real-time window into organic growth. The time savings alonefrom 4–6 hours per report down to 15–30 minutesjustifies the investment. More importantly, automated dashboards reveal opportunities for growth that manual reporting misses because they surface trends the moment they happen, not weeks later.
For teams scaling organic traffic at volume, tools like Jottler that automate content creation and publication add another layer of efficiency: your dashboard metrics automatically improve as daily content compounds organic visibility. Rather than reporting on static traffic, you're reporting on accelerating growth driven by 3,000+ word articles published daily, fact-checked and internally linked, feeding directly into your reporting metrics.
Start your SEO agent and watch your dashboard metrics trend upward month after month as automated content compounds your organic reach.
FAQs
What metrics should I include in my SEO dashboard for monthly reporting?
Focus on a four-tier framework: business outcomes (organic revenue, leads, CAC), traffic and visibility (organic sessions by intent, impressions, CTR, engaged sessions), rankings and features (visibility score, Core Web Vitals, index ratio), and AI visibility (branded search growth, AI citations). Limit your monthly dashboard to 8–12 core metricsanything more becomes noise. Each metric should drive a specific decision: revenue justification, content effectiveness, technical health, or competitive positioning in AI search. Append detailed breakdowns in secondary tabs for teams that need deeper analysis, but the executive summary should show only the metrics that move the business forward.
How do I automate my SEO reporting so I don't spend hours pulling data?
Use API-based integrations to connect GA4, Google Search Console, and your CRM directly to a BI tool (Looker Studio, Tableau, Power BI, or dedicated SEO reporting platforms). Schedule daily or weekly data pulls so your dashboard updates automatically. Set up formulas for month-over-month growth, year-over-year comparisons, and anomaly detection. Once configured, your dashboard populates itself daily and generates monthly reports on a scheduleno manual work required. The upfront setup takes 2–4 weeks depending on data complexity, but it saves 4–6 hours every single month forever.
Should I track individual keyword rankings in my monthly dashboard?
No. Individual keyword rankings create false confidence and don't drive business outcomes. Replace keyword position lists with an aggregate visibility score that measures your share of total search visibility in your market. Track visibility by keyword intent (informational, navigational, transactional) and pair it with traffic and revenue metrics to show the business impact of ranking improvements. Reserve detailed keyword tracking for weekly team standups or quarterly strategic reviews, not monthly executive reports. This shift aligns reporting with how search has actually evolvedAI Overviews and zero-click results mean rankings alone don't predict traffic anymore.