
Core Web Vitals and Page Speed Impact
Every 100 milliseconds of delay costs real money. Amazon reported a 1% drop in revenue for every 100 ms of latency, and modern research confirms the pattern: mobile users abandon pages that take more than 3 seconds to load at a 53% rate. Yet only 47% of websites currently pass Google's Core Web Vitals thresholds, leaving the majority vulnerable to ranking penalties and conversion collapse.
The cost isn't just abstract. A typical ecommerce site losing even 5% of transactions to slow load times across 10,000 monthly visitors can leave thousands of dollars on the table. For B2B software teams, the impact is even steeper: a page loading in 1 second converts 3× better than one loading in 5 seconds.
The fix isn't complex, but it is urgent. Core Web VitalsGoogle's three-metric system measuring load speed, responsiveness, and visual stabilityhave become non-negotiable for organic visibility. Here's how to understand their impact and implement the fixes that actually move the needle.
Key Takeaways
- 47% of websites pass Core Web Vitals, making speed a competitive differentiator (2025 industry data). Pages that meet Google's thresholds enjoy measurable ranking advantages, especially on mobile.
- A 100 ms delay reduces conversion rates by 1–7% depending on platform and industry. The 3-second load-time threshold is when mobile abandonment spikes dramatically.
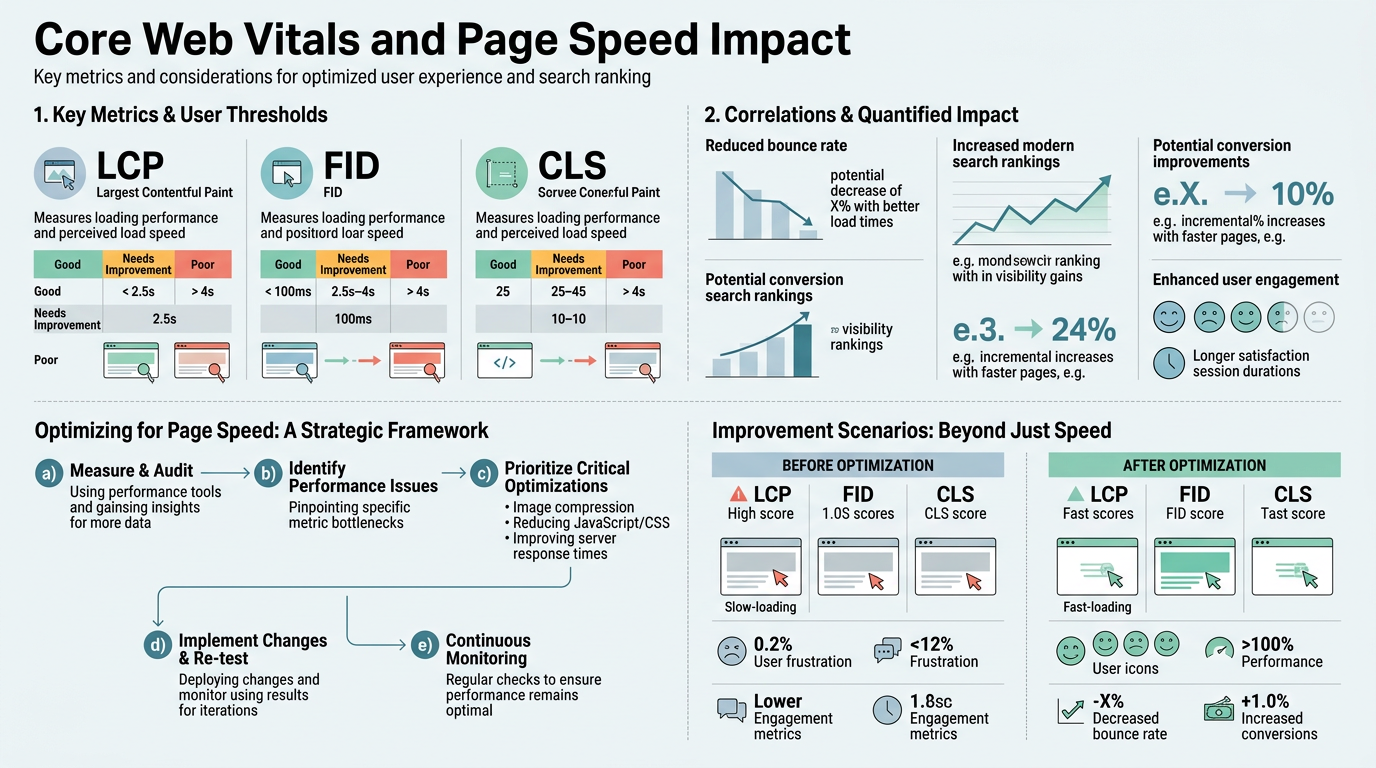
- The three Core Web Vitals are LCP (Largest Contentful Paint < 2.5s), INP (Interaction to Next Paint < 200ms), and CLS (Cumulative Layout Shift < 0.1). All three matter equally for page experience ranking.
- Three Core Web Vitals Metrics: LCP measures loading speed, INP measures responsiveness, CLS measures visual stabilityall three are ranked signals.
- Real-World Conversion Impact: Slow pages lose users immediately; 53% of mobile visitors abandon after 3 seconds, translating to direct revenue loss.
- Google's Integration in Search: Core Web Vitals are measured using real Chrome user data and influence how Google assesses page experience in search results.
- Measurement and Monitoring: Google Search Console, PageSpeed Insights, and Chrome User Experience (CrUX) data provide the official metrics Google uses for ranking.
- Optimization Levers: CDN deployment, image optimization, reducing render-blocking resources, and server-side rendering are the high-impact fixes most teams miss.
What Are Core Web Vitals and Why Do They Matter for SEO?
Core Web Vitals are three specific metrics Google uses to measure the quality of user experience on your pages. Google Search explicitly defines Core Web Vitals as signals that assess loading performance, interactivity, and visual stability. These metrics are drawn from real user behavior in Chrome, not synthetic lab tests. That distinction matters: Google ranks pages partly on how they perform for actual visitors, not theoretical conditions.
The business stakes are direct. Page speed correlates with both SEO ranking and conversion ratethey're not separate problems. When performance improves, both metrics typically move in the same direction. The reason is simple: users leave slow sites, which sends negative engagement signals to Google. Sites that keep users on the page longer rank higher and sell more.
The Three Core Web Vitals Explained
Largest Contentful Paint (LCP) measures how quickly the largest piece of content above the fold becomes visible. "Largest" typically means the primary hero image, heading, or content block. The threshold is 2.5 seconds. Sites like Medium, which rely on fast image rendering, prioritize LCP aggressively because users judge page speed in the first two seconds. If the main content hasn't loaded by 2.5s, the page is flagged as slow.
Interaction to Next Paint (INP) is the responsiveness metrichow quickly your page responds when a user clicks a button, submits a form, or taps a link. The threshold is 200 milliseconds. INP replaced First Input Delay (FID) in 2024 and is far more comprehensive. It captures the entire interaction pipeline from click to visual response, not just the initial delay. This is why slow JavaScript and unresponsive event handlers now hurt you more visibly in search rankings.
Cumulative Layout Shift (CLS) measures visual stability. CLS penalizes pages where content jumps around during loadlike when an ad loads and pushes text down, or an image renders and reflows the page. The threshold is 0.1, a very tight score. A single unanchored image or late-loading web font can blow your CLS score. This metric is the most frustrating for users and for your ranking.
Why Google Ranks Speed as a Ranking Factor
Page speed is a ranking factor because it's a proxy for user satisfaction. Google's research shows that 53% of mobile users leave a page if it takes more than 3 seconds to load. High abandonment rates signal poor content or UX, so Google deprioritizes slow pages in favor of faster competitors. This isn't arbitraryit's pragmatic. Faster pages mean more engaged users, which validates Google's own relevance algorithm.
The ranking boost from speed is real but incremental. Core Web Vitals alone won't push a weak article to rank #1. But when two pieces of content are similar in topic authority and relevance, the faster page typically outranks the slower one, especially on mobile. Think of speed as a tiebreaker. For product pages and landing pageswhere direct competitor comparison is commonspeed becomes a primary differentiator.
How Does Page Speed Impact SEO Rankings?
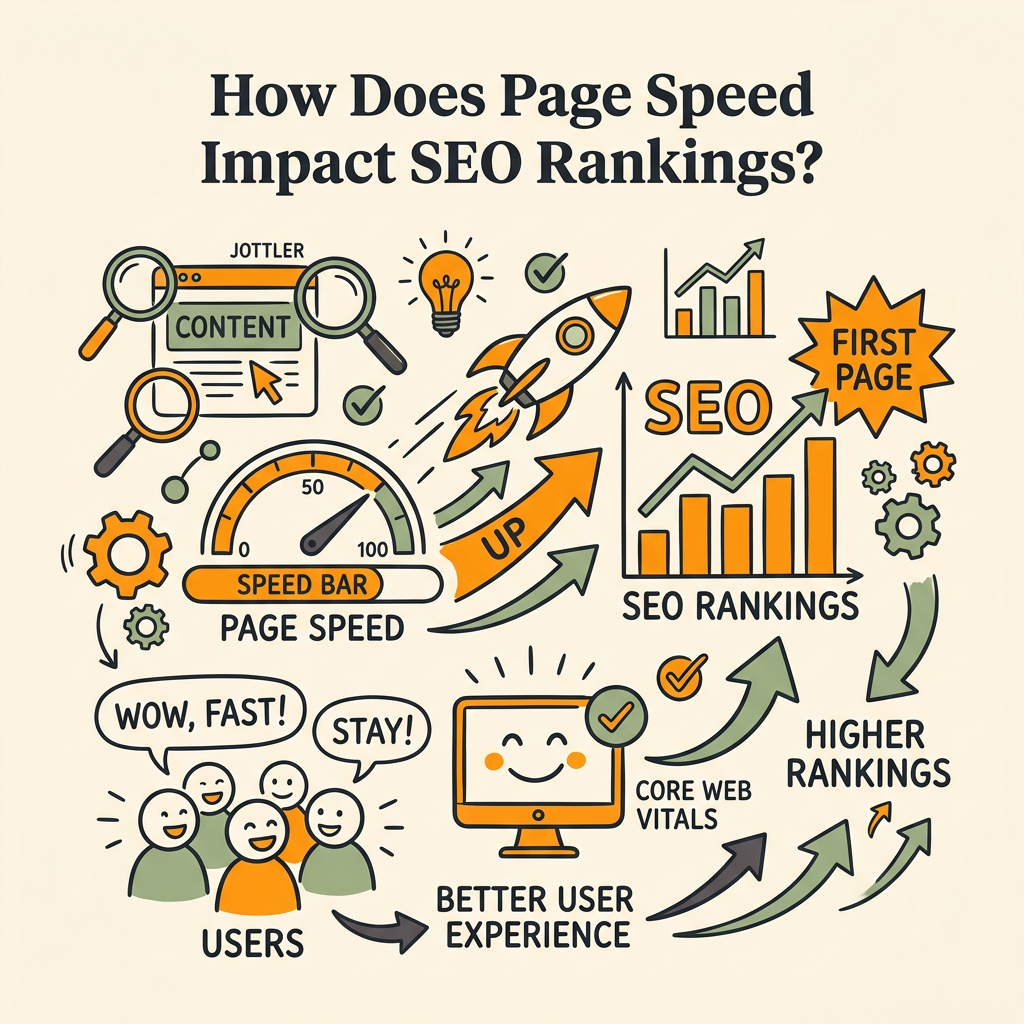
Speed is a confirmed Google ranking signal, but its power is contextual. Content relevance and authority still dominate the ranking algorithm; speed operates as a modifier that tips the balance when competitors are close. Understanding this nuance prevents wasted effort.
Page Speed as a Ranking Multiplier, Not a Guarantee
Getting a perfect Core Web Vitals score will not rank a poor article above excellent competitors. A 2025 analysis from DebugBear confirms that Core Web Vitals act as a ranking signal within Google's broader page-experience framework. This means speed improvements deliver the most benefit when:
- Your content is competitive in relevance and depth: You're already ranking on the first or second page, and competitors are similarly authoritative.
- Your traffic is primarily mobile: Mobile users are far more sensitive to slow pages. A desktop-optimized site with poor mobile CWVs loses mobile search visibility.
- Your industry is competitive: SaaS, ecommerce, and content-heavy categories see more correlation between speed and rankings because competitors have also optimized.
Conversely, if you're trying to rank a new domain with thin, derivative content, fixing Core Web Vitals won't overcome content weakness. Speed optimization works best as part of a broader content and authority strategy, not as a standalone fix.
Mobile-First Indexing and Speed
Google indexes the mobile version of your site first and uses mobile page speed as the primary ranking signal. Mobile users tolerate far less latency than desktop usersa 1-second delay on mobile can reduce conversions by up to 20%, compared to smaller losses on desktop. This is why mobile Core Web Vitals performance matters more than desktop.
If your mobile site loads in 4 seconds but your desktop site loads in 2 seconds, you're being ranked on your slower version. Responsive design isn't enough; you must actively optimize mobile assets, reduce HTTP requests, and serve mobile-appropriate images. Tools like responsive images with srcset and modern formats like WebP are non-negotiable.
The Relationship Between Speed and Organic Traffic Volume
Improving Core Web Vitals typically produces a gradual rise in organic traffic, not a sudden spike. The mechanism is threefold:
- Direct ranking boost: Better Core Web Vitals scores move your pages up a position or two in borderline cases.
- Improved crawl efficiency: Faster pages load quicker for Google's crawler, allowing more crawling per day, which helps discovery of new content.
- Reduced bounce rate: Users stay on fast pages longer, sending positive engagement signals that reinforce rankings over weeks.
Unlike link-building or content creation, speed improvements don't produce explosive traffic gains. Instead, they compound over time as Google's algorithm recognizes sustained improvement in your page experience metrics.
What Is the Real Business Impact of Page Speed?
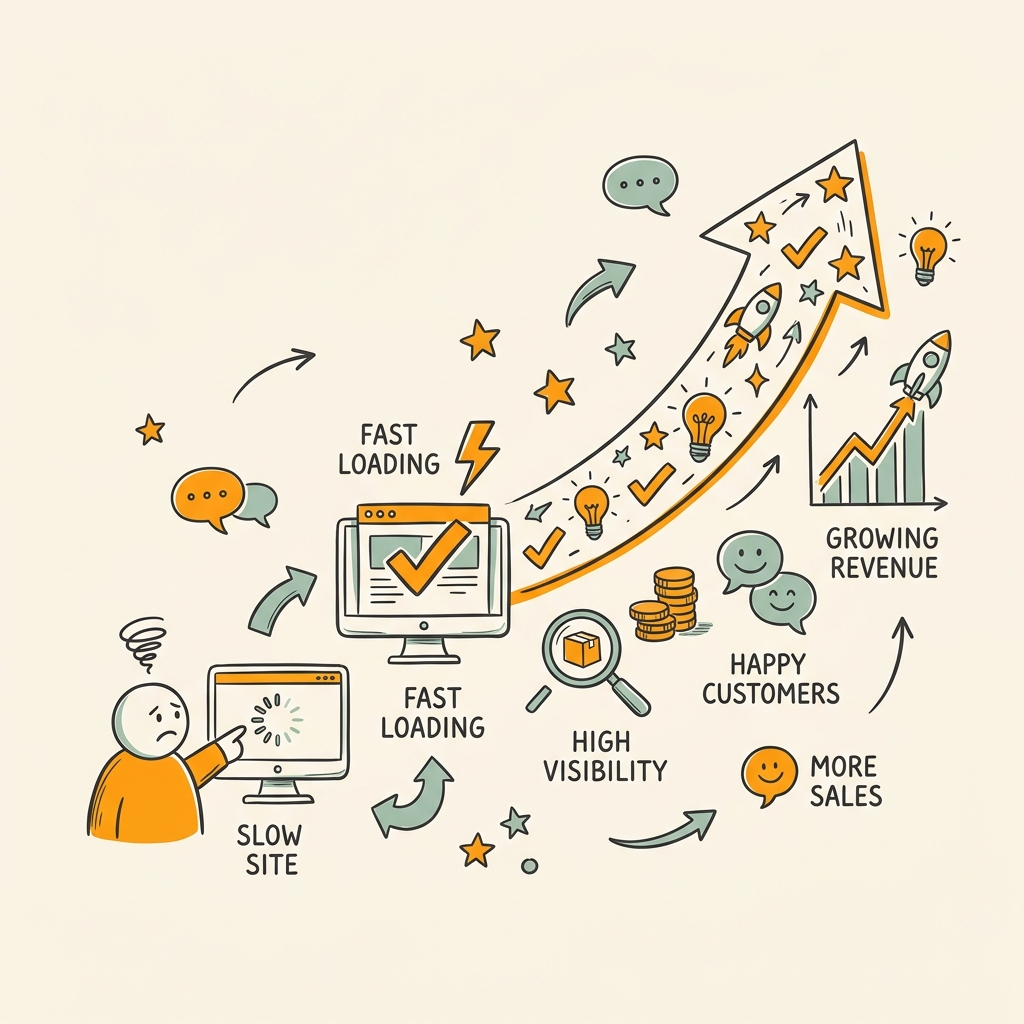
Rankings are the long game. Conversions are immediate. The business case for page speed often comes down to lost revenue, not lost search positions. Understanding the financial impact is essential for securing budget and priority.
Conversion Rate Loss from Slow Pages
The conversion-rate penalty for slow pages is material and measurable. A 100 millisecond delay can reduce conversion rates by 1–7% depending on platform (the range reflects variation across research and industry). For context: a 1-second delay reduces conversions by approximately 7%, and a 3-second load time sees 53% of mobile users abandon. These aren't theoreticalthey're backed by billions of user interactions across major platforms.
The practical impact on a mid-size ecommerce site is stark. If your site processes $1 million in annual revenue and averages $100 per order, a 2-second slowdown could cost roughly $140,000 in lost revenue annually. For B2B software with longer conversion windows, the loss compounds across the funnel as slower pages reduce qualified-lead submissions and demo request fills.
User Behavior and Abandonment Thresholds
User tolerance for slow pages has a sharp cliff. Bounce probability increases by 32% when page load time goes from 1 second to 3 seconds. Beyond 3 seconds, abandonment accelerates further. This is why targeting sub-3-second load times is so criticalit's the threshold where user behavior changes dramatically.
The threshold varies by page type. Checkout pages are more speed-sensitive than homepages. Search result pages (especially internal site search) see higher abandonment from slowness than blog posts. The lesson: prioritize speed on high-value pages firstproduct pages, checkout, signup forms, and landing pages.
Mobile vs. Desktop Speed Impact
Mobile speed impact is 2–3× larger than desktop impact for the same load-time penalty. A page that loads in 4 seconds on mobile loses more users than the same page on desktop. This is partly because mobile users are on metered connections and partly because they're in a hurry. The implication: mobile optimization must be your baseline, not a nice-to-have.
How to Measure and Monitor Core Web Vitals
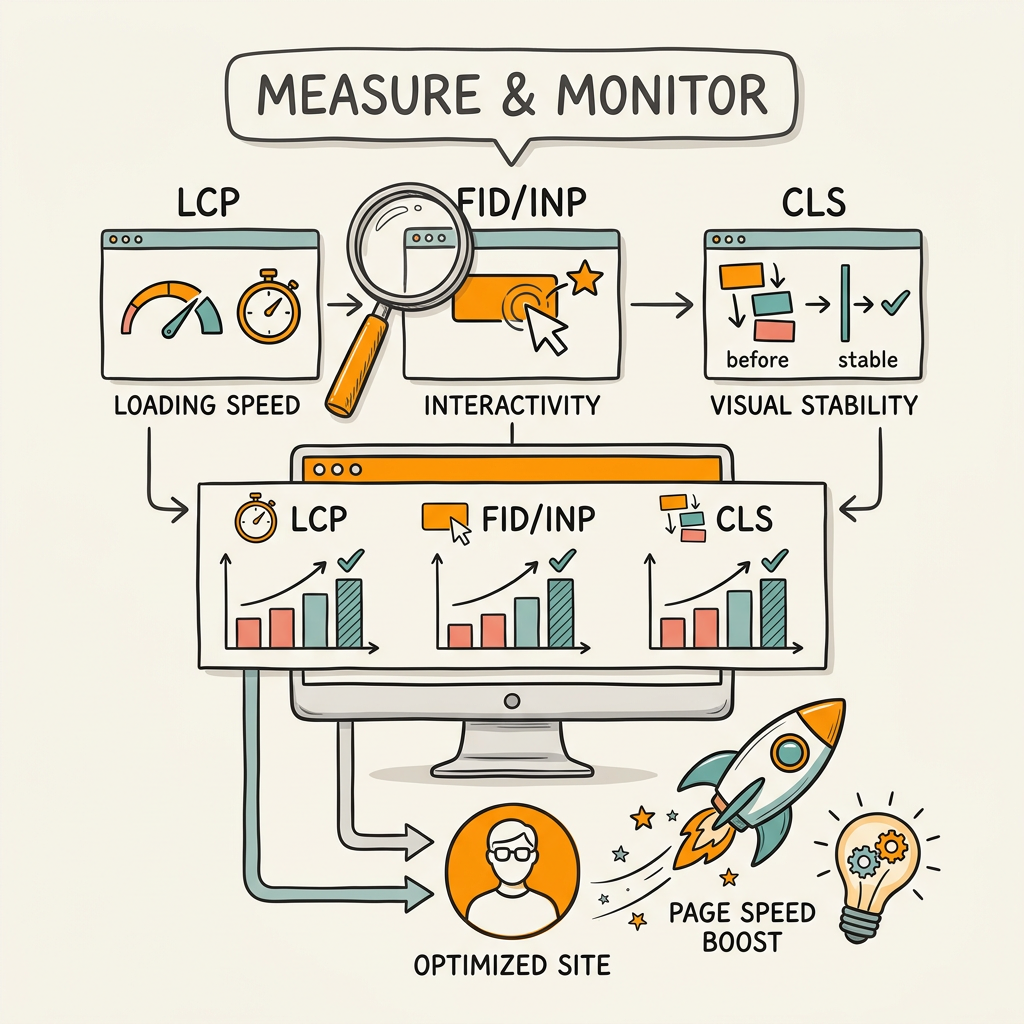
Measurement is the foundation of optimization. You can't improve what you don't measure. Google provides free, authoritative tools for tracking Core Web Vitals, and you must use them.
Google Search Console for CWV Reporting
Google Search Console is the single source of truth for your Core Web Vitals performance. It shows how your pages perform on real Chrome user data (the Chrome User Experience, or CrUX dataset) and highlights which pages fail each metric. The Core Web Vitals report breaks down performance by device type (mobile, desktop, tablet), which is essential for prioritization.
The typical audit flow is: log into Search Console, navigate to Experience > Core Web Vitals, identify which metric your site struggles with, find the affected pages, and prioritize fixes. This process takes 10 minutes and reveals your most damaging performance gaps.
PageSpeed Insights for Per-Page Analysis
PageSpeed Insights (powered by Lighthouse) provides both CrUX data and synthetic lab performance. The tool measures your page in a simulated 4G environment on a mid-range mobile device. Lab data is useful for debugging but is not the metric Google uses for rankingalways prioritize CrUX field data from Search Console.
PageSpeed Insights shows you a waterfall of asset load times and suggests optimization opportunities. Common recommendations include:
- Eliminate render-blocking JavaScript and CSS
- Defer non-critical CSS and JavaScript
- Optimize images and use modern formats
- Leverage browser caching and CDN
- Reduce server response time (TTFB)
These recommendations are actionable, but not all will yield equal returns. Reducing large uncompressed images typically pays off faster than eliminating render-blocking resources on a lean site.
Real User Monitoring for Ongoing Performance
Free tools measure your current state, but ongoing monitoring prevents regression. Real User Monitoring (RUM) tools collect Core Web Vitals data from your actual traffic, segmented by geography, device, connection type, and page. This granularity is crucial because a page might pass CWVs for desktop in Silicon Valley but fail for mobile in Southeast Asia.
Setting up RUM is simple: add a small script tag to your site (many platforms offer this as an integrated feature), and the tool passively reports performance to a dashboard. You can then set alerts for when CWVs degrade or set traffic-based SLOs (e.g., "95% of mobile users experience LCP < 2.5s"). When publishing content at scale, automated content publishing platforms must include performance audits in their pipeline to prevent publishing articles that degrade your site's overall Core Web Vitals score.
The Top Optimization Strategies to Improve Core Web Vitals
Optimization requires targeting the right metric on the right pages. A cookie-cutter approach fails. Your largest win might be reducing JavaScript on one page type, image optimization on another, and server-side rendering on a third.
Largest Contentful Paint (LCP < 2.5s) Optimization
LCP is the most visible metric to users and the most commonly failing one. The main content element needs to render in under 2.5 seconds. Common LCP failures come from slow servers, large unoptimized images, and render-blocking resources.
High-impact LCP fixes in order:
- Reduce server response time (TTFB): Optimize your backend, move to a faster host, or deploy a CDN. Even a 200ms TTFB improvement cascades into LCP improvements.
- Optimize and compress images: Large hero images are the single biggest LCP killer. Use responsive images, modern formats (WebP, AVIF), and lazy-loading where safe.
- Defer non-critical JavaScript: Scripts that fire on page load block rendering. Defer or async them if they're not required above the fold.
- Cache aggressively: Browser caching and CDN caching reduce TTFB. Set cache headers to 1+ year for static assets.
Testing the impact: improve one lever at a time, wait 7 days for CrUX data to update, and measure the change in Search Console. This prevents false positives from other traffic variance.
Interaction to Next Paint (INP < 200ms) Optimization
INP is the hardest metric to optimize because it requires clean JavaScript execution. Slow JavaScript tasks, long-running operations, and unoptimized event handlers are common culprits.
Fixing INP requires code-level work:
- Profile JavaScript with Chrome DevTools: Run the Performance tab during interactions and look for tasks longer than 50ms. Break them into smaller tasks.
- Reduce JavaScript bundle size: Large JavaScript files take longer to parse and execute. Code-split and tree-shake to reduce payload.
- Use requestIdleCallback for non-critical work: Defer analytics, DOM updates, and other non-blocking operations to idle time.
- Upgrade third-party scripts: Ads, chat widgets, and analytics can block the main thread. Audit and consider alternatives.
This is the metric where many teams see diminishing returns because fixing it requires engineering effort, not just hosting tweaks. Budget accordingly.
Cumulative Layout Shift (CLS < 0.1) Optimization
CLS is the easiest metric to improve because it's often about declaring dimensions and avoiding dynamic DOM changes. CLS > 0.1 is a common fail point, but most sites can hit the "good" threshold with focused work.
CLS fixes are typically quick wins:
- Reserve space for images and videos: Set width and height attributes or aspect-ratio CSS to prevent layout shift when images load.
- Avoid injecting content above existing content: Sticky headers, banners, and ads that push content down drive CLS up. Use position: fixed or load them below the fold.
- Preload web fonts: Font swapping causes layout shifts if your fallback font has different metrics. Use font-display: optional or preload web fonts.
- Stabilize modal and overlay content: If you're using overlays, ensure they don't shift the page layout or don't shift significantly.
A typical site can improve CLS from 0.25 to 0.05 in a day of focused work. This is the metric with the highest ROI per engineering hour.
Content Delivery Networks and Caching Strategy
CDNs are table-stakes for page speed. A global CDN reduces server response time (TTFB) by distributing your content geographically, meaning users fetch from a server near them rather than from your origin. This is the single biggest lever for improving all three Core Web Vitals.
A modern caching strategy layers browser caching (1+ year for static assets), edge caching (via CDN, 1+ hour for HTML), and origin caching (1-30 minutes). This prevents repeated server requests and keeps your origin server's load low.
For content-heavy sites, a well-configured CDN can improve LCP by 300+ milliseconds immediately. It's one of the first things to audit if your TTFB is sluggish.
How Core Web Vitals Fit Into Your Broader SEO Strategy
Speed optimization doesn't live in isolation. It compounds with keyword research, content strategy, and link-building. A holistic SaaS SEO strategy integrates performance targets from the start rather than treating speed as an afterthought.
Prioritizing Pages for Optimization
Not all pages matter equally. Your highest-traffic, highest-value pages (product pages, landing pages, conversion funnels) should be optimized first. A 10% traffic page that converts at 3% is worth more optimization effort than a 50% traffic page that converts at 0.1%.
The analysis: in Search Console, export your Core Web Vitals report and cross-reference with your analytics. Filter for pages that are currently ranking but are failing CWVs. These are your quick wins. Then expand to pages that are ranking poorly partly due to speed.
For scaling content, platforms that automatically generate and publish at volume must have performance built into their publishing pipeline. Publishing 100 new articles per month means nothing if 80% fail Core Web Vitals. This is why audit-before-publish is critical for scaled content operations.
Speed as Part of Content Strategy
Your content strategy should include performance targets from day one. Setting a target of LCP < 2s and CLS < 0.1 at the planning phase prevents firefighting later. This means:
- Choosing lightweight templates and designs: Simpler designs load faster. Every feature adds kilobytes and JavaScript.
- Optimizing content bloat: Long articles with many images and embeds will be slower. Optimize the image count and sizing upfront.
- Limiting third-party scripts: Analytics, ads, and chat widgets are performance killers. Audit and keep only high-ROI integrations.
- Planning for mobile-first: Design for mobile constraints first, then enhance for desktop. This naturally leads to lighter, faster pages.
When combined with consistent publishing velocity, performance-conscious content strategy compounds SEO benefits far faster than irregular, performance-heavy updates.
Monitoring Performance as Traffic Scales
As your site grows, performance often decays. More content means more database queries, heavier pages, and increased server load. Proactive monitoring prevents this collapse.
Set up alerting in your RUM tool: if Core Web Vitals degrade by 10%, trigger an alert. This catches problems before they affect rankings. Also monitor p75 metricsGoogle ranks on the 75th percentile of user experiences, not the median. A site with fast p50 and slow p75 will lose rankings.
Conclusion
Core Web Vitals are no longer optional. With 47% of sites currently failing the thresholds, meeting them is a competitive advantage. The impact is dual: pages that load faster rank higher in Google and convert visitors at significantly higher rates. A 100-millisecond improvement on your product pages alone can translate to measurable revenue gains, and ranking improvements compound that effect over months.
The optimization path is clear: measure your current state in Google Search Console, prioritize the metric and pages causing the most impact, implement fixes in order of ROI, and monitor continuously. Largest Contentful Paint is your starting point for most sites; Cumulative Layout Shift is usually the fastest win; and Interaction to Next Paint requires engineering depth but unlocks long-term competitiveness.
For teams shipping content at scale, integrating performance audits into the publishing pipeline is essential. Start automating your content with Jottler to ensure every article you publish meets Core Web Vitals baselines before going live, preventing the performance debt that derails organic growth.
FAQs
How do Core Web Vitals impact search rankings?
Core Web Vitals are a confirmed ranking signal within Google's page-experience framework, meaning they influence where your pages appear in search results. However, they are not the primary ranking drivercontent relevance, topical authority, and backlinks still matter more. The impact is strongest when competitors are similar in content quality and authority, in which case faster pages typically outrank slower ones. Mobile Core Web Vitals matter more than desktop because Google indexes the mobile version first. Improving from "poor" to "good" Core Web Vitals can produce a gradual ranking boost over weeks, especially for high-traffic, competitive pages.
What is a good Core Web Vitals score?
Google defines "good" Core Web Vitals as: LCP under 2.5 seconds, INP under 200 milliseconds, and CLS under 0.1. These thresholds represent the 75th percentile of real user experience. A page passes Core Web Vitals when all three metrics meet their respective thresholds. Currently, only 47% of websites achieve this, making it a meaningful differentiator. Aim to target these thresholds on your top-traffic pages first. For less critical pages, aiming for the "needs improvement" range (LCP 2.5–4s, INP 200–500ms, CLS 0.1–0.25) is acceptable as a longer-term target.
How much does page speed actually affect conversion rates?
Page speed has a material, measurable impact on conversions. A 100-millisecond delay can reduce conversions by 1–7% depending on platform and industry, and this effect is largest on mobile where users are most impatient. The 3-second load-time threshold is critical: abandon rates spike sharply beyond that point, with some studies finding 53% of mobile users leaving after 3 seconds. For B2B, the impact is even largerpages loading in 1 second convert 3× better than pages loading in 5 seconds. The bottom line: speed improvements directly impact revenue, making performance optimization as important for CRO as it is for SEO.