Mastering Organic Traffic Analysis for Growth
Understanding your organic traffic isn't about chasing vanity metrics anymore. Organic search traffic declined 2.5% year-over-year as AI Overviews and zero-click searches reshape the SERP landscape, yet clicks that do convert through organic channels outperform paid by 23%. The real opportunity isn't in raw visitor volume—it's in analyzing which traffic actually drives revenue. This shift demands a new framework for measurement and optimization that separates signal from noise.
Key Takeaways
- 60% of Google queries now result in zero clicks, making traffic volume alone an unreliable metric for growth (2026, Digital Applied)
- Position #1 ranking captures 39.8% of clicks—an order-of-magnitude difference from position 5 (4.1%), so ranking improvements compound rapidly
- Organic conversion quality matters more than volume: 100 visitors with an 8% conversion rate outperform 1,000 visitors with a 0.3% rate
- AI Overviews reduce organic CTR by 65% on affected queries, requiring tactical shifts to target high-intent keywords and featured snippets
- Shift from traffic quantity to conversion quality: Measure revenue-aligned KPIs instead of raw visitor count to identify what actually drives business growth.
- Segment traffic by intent and source: Branded vs. non-branded, long-tail vs. head keywords, and new vs. returning visitors reveal which content clusters actually convert.
- Track revenue-driven KPIs: Organic conversion rate, customer acquisition cost, and customer lifetime value replace outdated CTR benchmarks.
- Optimize for AI Overviews and zero-click impact: Target featured snippets, long-tail queries, and high-intent keywords less affected by AI abstraction.
- Build an automated measurement system: Connect analytics, search console, and CRM data to automatically surface actionable insights without manual reporting.
Why Traditional Organic Traffic Metrics Fail Modern Marketing Teams
Organic traffic volume has become a lagging, disconnected indicator of real business value. Nearly 50% of consumers now use AI-powered search tools alongside Google, fragmenting the traffic composition that made simple visitor counts meaningful five years ago. A thousand visitors bouncing in three seconds don't help your business—a hundred visitors converting at 8% do.
"The competitive advantage in 2026 goes to teams that can correlate organic sessions directly to business outcomes. That requires building a measurement framework that connects your organic search strategy to the metrics that matter—conversions, qualified leads, and revenue."
This is why teams optimizing for raw traffic are burning resources on low-intent keywords while ignoring the high-intent segments that actually drive revenue. The problem? Most analytics dashboards are built around traffic volume, not business outcome. They answer the wrong question. Instead of "How much traffic did we get?" successful teams ask "Which traffic generated revenue, and how do we get more of it?"
The competitive advantage in 2026 goes to teams that can correlate organic sessions directly to business outcomes. That requires building a measurement framework that connects your organic search strategy to the metrics that matter—conversions, qualified leads, and revenue. Generic traffic targets waste engineering resources on the wrong problems.
How to Define and Segment Organic Traffic for Actionable Insights
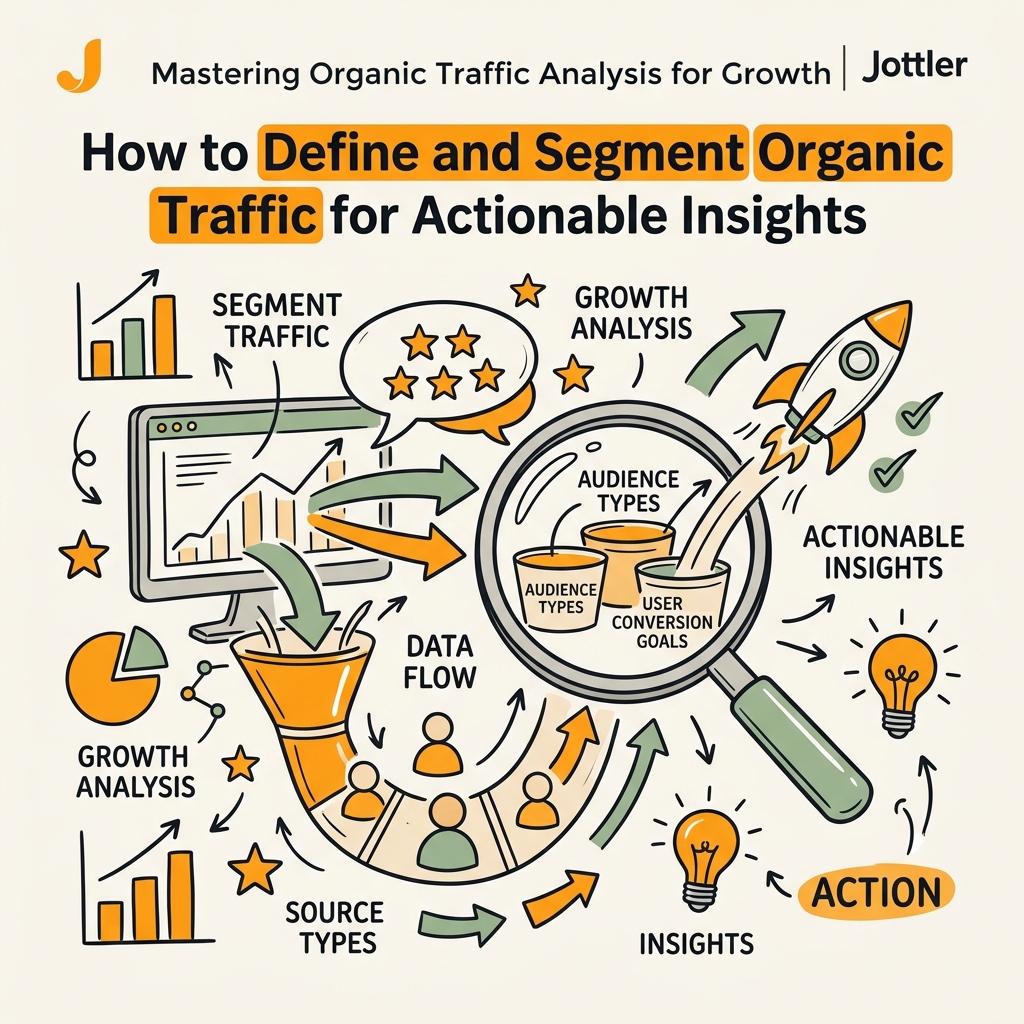
Segmentation is where generic traffic data becomes tactical intelligence. Raw organic traffic is meaningless without context. A session from someone searching "best project management software for enterprise" has fundamentally different value than traffic from "free project management tools." One visitor is evaluating a purchase; the other is browsing.
Start with these foundational segmentation strategies:
- Branded vs. non-branded traffic: Branded searches (your company name, product names) signal existing awareness and intent to engage. Non-branded traffic represents new discovery. Growing non-branded traffic with stable conversion rates proves your SEO strategy is expanding reach. Declining non-branded conversion rates suggest ranking gains for lower-intent keywords.
- Commercial-intent vs. informational queries: Filter Google Search Console for keywords containing "best," "pricing," "vs.," "comparison," "review," or "software." These typically drive 70% more qualified leads than generic informational content. Track CTR separately for commercial segments—they'll have higher CTR because searchers have stronger intent.
- Long-tail vs. head keywords: Over 80% of organic search traffic comes from long-tail keywords (3+ words). Head keywords ("project management") have enormous volume but low conversion rates. Long-tail queries ("best project management software for remote teams with budget under $50/month") convert 3-4x better because they signal specific user needs.
- Traffic by content type: Blog posts, product pages, comparison content, and case studies serve different roles in the buyer journey. Segment traffic by page type to identify which content clusters drive the most qualified visitors. Many teams discover their blog generates 40% of traffic but only 5% of conversions—signaling a gap between content strategy and business goals.
- New vs. returning sessions: Returning organic visitors often convert at 2-3x the rate of new visitors. Track repeat visitor percentage to understand content quality and topical authority.
Most analytics platforms make segmentation tedious, which is why many teams skip it and rely on vanity metrics instead. Automating traffic analysis through AI-driven systems eliminates this manual work, surfacing high-intent segments and conversion trends without weekly spreadsheet wrestling.
The Core Metrics That Predict Revenue Growth
Not all organic traffic metrics matter equally. Position #1 captures 39.8% of clicks, position 2 takes 18.7%, and position 3 drops to 10.2%. This isn't linear—it's exponential. The metrics that predict revenue follow a similar curve: a few KPIs drive 80% of your revenue, while most teams are obsessing over metrics that move the needle almost not at all.
"A session generating $2 in revenue is 10x more valuable than a session generating $0.20, regardless of traffic volume. Revenue per organic session directly measures business impact and should be your north star metric."
| Metric | Why It Matters | How to Measure It | Your Goal |
|---|---|---|---|
| Organic Conversion Rate | The percentage of organic visitors who complete a target action (sign-up, purchase, demo request). This is THE metric that connects traffic to revenue. | Google Analytics 4: Acquisition → Traffic Acquisition, filter "Organic Search," divide conversions by sessions | Benchmark: 2-5% for B2B SaaS (higher for e-commerce after optimization) |
| Revenue Per Organic Session | Directly measures business impact. A session generating $2 in revenue is 10x more valuable than a session generating $0.20, regardless of traffic volume. | GA4: Add transaction revenue as an event, filter by organic traffic source, divide total revenue by organic sessions | Track weekly and monthly trends; prioritize keywords that increase this metric |
| Cost Per Acquisition (CPA) from Organic | Organic traffic is "free" in impressions, but your content creation cost is real. Divide your content marketing budget by organic conversions to measure true acquisition cost. | Content marketing spend ÷ organic conversions in measurement period | Lower is better; track by content cluster to identify underperforming topics |
| Organic Click-Through Rate (CTR) | Measures whether your title tags, meta descriptions, and snippets effectively communicate relevance. Declining CTR despite maintained rankings signals increased SERP feature competition or messaging misalignment. | Google Search Console → Performance tab → filter by date range, compare position-specific CTR trends | Position 1: 20-40%; Position 2: 12-19%; Position 3: 8-12% (2026 benchmarks, pre-AI Overview) |
| Qualified Lead Rate | What percentage of organic visitors meet your definition of a qualified lead? Many teams discover 30% of traffic from brand-term keywords contributes 70% of qualified leads. | CRM integration: segment leads by organic traffic source, calculate MQL rate by landing page or keyword cluster | Benchmark by content type; prioritize SEO spend on content that generates high-quality leads |
Notice what's missing: raw traffic volume. That's intentional. The metrics that matter connect organic activity to business outcomes. Teams that obsess over monthly visitor counts while ignoring conversion rate are optimizing for the wrong thing. According to Searchengineland, organic search traffic overall is relatively stable, but the composition—zero-click searches, AI Overviews, and positional shifts—demands a complete measurement framework reset.
How to Analyze Traffic Quality Using Engagement Signals
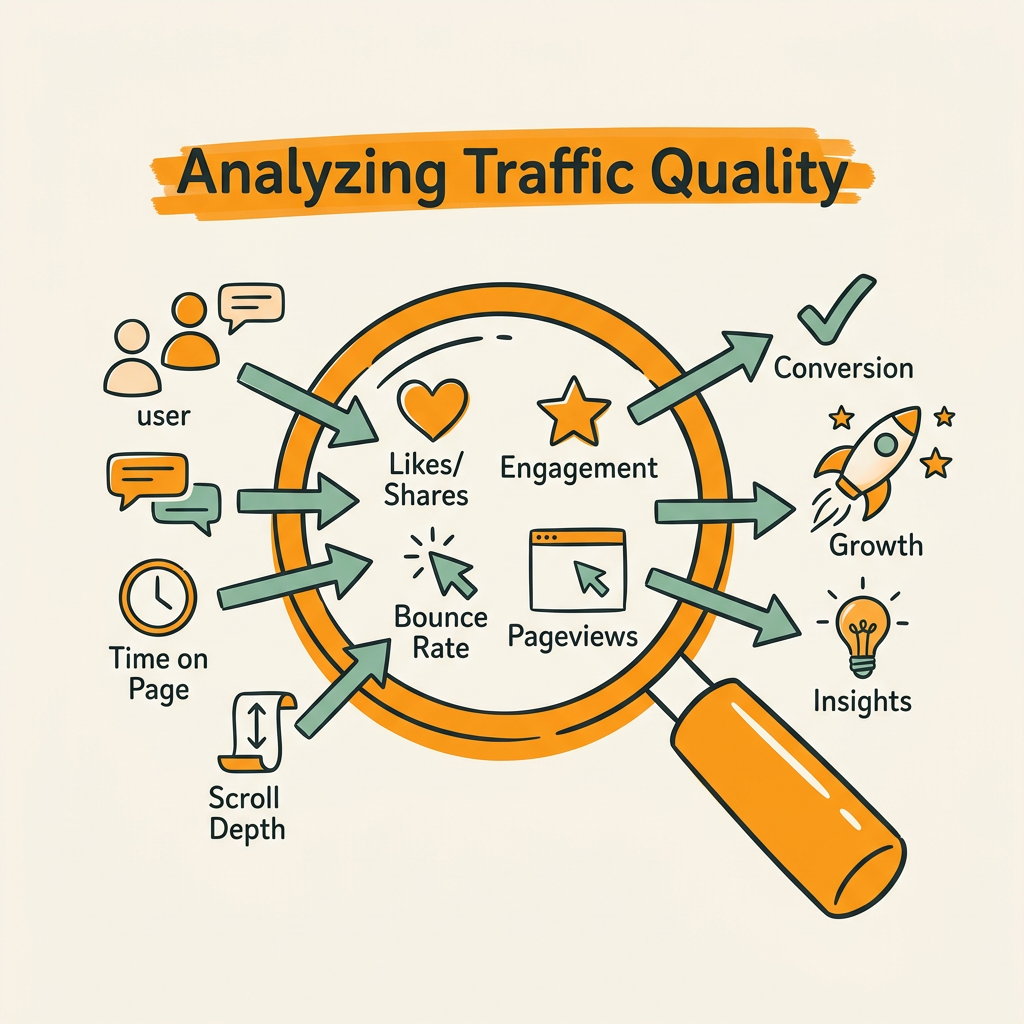
Traffic quality reveals whether your content aligns with search intent. A visitor who bounces in three seconds didn't want what your page offered. One who spends five minutes reading and clicks three internal links did. Engagement signals are your smoke detector for content-keyword mismatch.
Core engagement metrics to track:
- Bounce rate by landing page: High bounce rate (above 60%) on long-form content suggests either poor content quality, slow page load time, or keyword-to-content mismatch. Compare bounce rates by page and by traffic source (organic search from position 1 vs. position 6) to isolate the problem. Tools like SEO automation systems detect these patterns automatically across hundreds of pages.
- Average session duration: Segment by page and keyword. Blog posts should average 2-4 minutes if they're 1,500+ words. Product pages should average 1-2 minutes. Anything below that signals readers aren't engaging. Track this by content cluster to identify which topics resonate most with your audience.
- Pages per session: Users clicking multiple pages indicate navigation intent and content relevance. Compare pages-per-session for different traffic sources (organic from long-tail keywords vs. branded searches) to identify which segments explore your site vs. bounce immediately.
- Scroll depth: GA4 doesn't track this natively, but custom events can. For blog content, measure what percentage of visitors scroll past 50%, 75%, and 100% of the page. Below-average scroll depth suggests content isn't delivering on the headline promise.
This granular analysis reveals which keyword-content pairings work and which waste your ranking position. A page ranking #1 for a keyword but converting at 0.5% is worth less than a page ranking #8 but converting at 8%. That math compels a strategic shift: stop chasing volume alone; start optimizing for intent alignment and conversion quality.
Building a Keyword and Ranking Analysis Framework
Ranking position and keyword selection are the two levers that control your organic traffic volume and quality. Understanding how they interact requires a structured analysis framework that goes beyond "which keywords are we ranking for."
Step 1: Identify your keyword opportunity window
Most teams rank for roughly 500-5,000 keywords depending on site size. But opportunity lies in three distinct segments:
- Keywords you rank #1-3 for: These are your revenue engines. They require defense—monitor ranking stability, refresh content annually, and expand them into content clusters. A keyword you rank #1 for is worth 10x the effort to maintain than acquiring a rank for a new keyword.
- Keywords you rank #4-10 for: Optimization here yields the highest ROI. Moving from position 7 to position 3 typically multiplies clicks by 4-5x. Refresh content, improve internal linking, and enhance on-page SEO signals targeting these keywords.
- Keywords with high impressions but low CTR: Google Search Console shows you keywords where you rank but people don't click. Even without AI Overviews, organic CTR has declined 41% year-over-year. Improve your title tags and meta descriptions to increase CTR without improving rankings.
Step 2: Segment keywords by commercial value
Not all keywords are equal. Keywords with strong commercial intent convert 3-5x better than informational keywords. According to Performance Marketing Advisors, the best SEO strategy starts with intent alignment. In Google Search Console, tag keywords manually by intent:
- High-intent commercial: Keywords with "pricing," "buy," "software," "best [for specific use case]," "comparison," or "review." These drive most conversions.
- Mid-intent exploratory: Keywords exploring a solution space but not yet ready to buy. Example: "how to manage distributed teams" (blog-driven, typically top-of-funnel).
- Low-intent informational: Broad keywords with educational intent but low commercial value. Example: "what is project management."
Allocate your ranking-improvement efforts 50% to high-intent keywords, 30% to mid-intent, and 20% to low-intent. Most teams reverse this allocation, which is why they scale traffic without scaling revenue.
Step 3: Analyze ranking volatility and competitive dynamics
Rankings fluctuate. Monthly variance of 1-2 positions is normal and doesn't require action. Variance of 5+ positions or consistent decline requires investigation. Use historical ranking data to identify:
- Keywords where competitors are gaining ground (refresh your content to maintain position)
- Keywords where your content has stalled (add internal links, improve technical SEO, or expand content depth)
- Seasonal ranking patterns (many B2B keywords peak in September-October)
Measuring the Impact of AI Overviews and Zero-Click Searches
AI Overviews have fundamentally changed how to interpret organic traffic decline. When Google displays an AI-generated summary at the top of the SERP, organic CTR drops 65% on average. But the click-through rate for users who see it and want more detail is often higher. This means your strategy must shift from "maximize impressions" to "optimize for the qualified clicks that remain."
"Don't fight zero-click searches. Instead, dominate them. A featured snippet showing your content on 10,000 monthly searches (even if only 300 click through) builds brand authority and trust more efficiently than chasing 2,000 clicks from a keyword with lower trust."
Track which keywords trigger AI Overviews using tools like DataSlayer or manual SERP inspection. Then segregate their performance:
- Keywords with AI Overviews: Lower absolute CTR expected. Optimize for featured snippets (content above the AI Overview), long-tail variations, and high-intent long-form content. 27.6% of Google searches result in an organic click overall; for AI Overview queries, expect closer to 10%.
- Keywords without AI Overviews: Maintain traditional CTR optimization and ranking position focus.
- Zero-click searches: 60% of Google queries now result in zero clicks. This is actually beneficial if you're appearing in Knowledge Panels, featured snippets, or local results—you're getting visibility without bearing CPC cost. Measure this by tracking branded search volume and brand awareness metrics alongside traditional traffic.
The winning strategy is counterintuitive: don't fight zero-click searches. Instead, dominate them. A featured snippet showing your content on 10,000 monthly searches (even if only 300 click through) builds brand authority and trust more efficiently than chasing 2,000 clicks from a keyword with lower trust.
Building an Automated Organic Traffic Analysis Dashboard
Manual analysis is a bottleneck. Most marketing teams either skip traffic analysis entirely because it's tedious, or they spend 10+ hours weekly on spreadsheets. Neither scales. The teams winning in 2026 have automated the entire analysis pipeline—connecting Google Analytics, Search Console, and CRM data into a single automated reporting system that surfaces actionable insights weekly.
Your analysis infrastructure should automatically:
- Flag ranking changes: Alert you when a keyword drops 3+ positions or climbs into the top 5. Rapid response to drops prevents further decay.
- Identify high-intent traffic sources: Automatically segment commercial-intent traffic and show its conversion metrics separately. If your dashboard can't tell you "commercial-intent keywords converted at 4.2% this month, up from 3.8% last month," you're flying blind.
- Connect organic traffic to revenue: Pipeline revenue-attributed organic sessions into your dashboard so you can see which keywords and content clusters drive actual dollars, not just clicks.
- Surface content optimization opportunities: Pages ranking #4-10 with high search volume are your quick wins. Automated systems flag these instantly instead of waiting for monthly review.
- Monitor AI Overviews impact: Track CTR trends for keywords with and without AI Overviews separately. Watch for SERP feature changes that affect your visibility.
Building this manually with SQL queries and scheduled scripts is technically possible but requires ongoing maintenance. Alternatively, automated SEO strategies for scaling organic traffic eliminate manual reporting entirely, feeding rich traffic intelligence directly into your decision-making cycle. The best analysis is worthless if it arrives too late to act on it.
Establishing Organic Traffic Benchmarks and Growth Targets
Benchmarking against industry standards helps separate healthy performance from underperformance. But the benchmarks that matter are revenue-aligned, not traffic-aligned.
Realistic 2026 benchmarks by traffic type:
- Organic conversion rate (B2B SaaS): 2-5% depending on product complexity and sales cycle. Consumer e-commerce: 1-3%. High-intent commercial keywords: 4-8%.
- Organic CTR by position (without AI Overviews): Position 1: 20-40%, Position 2: 12-19%, Position 3: 8-12%, Position 4: 6-8%, Position 5+: 2-4%.
- Bounce rate by content type: Blog posts: 40-60%, Product pages: 20-40%, Comparison/review content: 30-50%.
- Revenue per organic session: Ranges from $0.05 (informational blog monetized with ads) to $50+ (high-intent landing pages in enterprise SaaS).
Set your targets based on current performance, not industry averages. If your current organic conversion rate is 1.2%, a target of 2.5% is ambitious but achievable through segmentation and intent optimization. A target of 8% is unrealistic and wastes planning energy. Building an AI-driven content strategy that focuses on high-intent keyword clusters accelerates this benchmarking process by automatically surfacing which content clusters convert best.
Conclusion
Mastering organic traffic analysis means abandoning the traffic-at-all-costs mindset and embracing a revenue-aligned measurement framework. Position #1 rankings deliver 39.8% of clicks versus 4.1% for position 5—a tenfold difference that compounds every month. Yet 60% of searches result in zero clicks, shifting the battleground to featured snippets and high-intent keywords. The teams winning in 2026 aren't chasing raw visitor volume; they're segmenting traffic by quality, connecting clicks to conversions, and automating the entire analysis pipeline to act on insights in real time.
The path forward requires three commitments: segment your traffic by intent and source to separate signal from noise, measure revenue-driven KPIs instead of vanity metrics, and automate analysis to eliminate the tedious manual work that prevents most teams from implementing what they learn. When you can see which keywords, content types, and traffic segments actually drive revenue—and update your strategy weekly—you've transformed organic traffic from a lagging indicator into a real business lever.
Start your SEO agent to automate both your content production and traffic analysis, eliminating manual reporting and surfacing high-intent growth opportunities automatically.
FAQs
How do I analyze organic traffic quality?
Quality is measured through engagement and conversion metrics, not volume. Segment your organic traffic by landing page and keyword, then compare bounce rate, average session duration, and conversion rate across segments. Traffic from high-intent commercial keywords (those containing "pricing," "best for," or "comparison") typically converts 3-5x better than informational traffic. Use Google Analytics 4 to filter organic sessions by traffic source and track engagement events—clicks to product pages, demo signups, or time-on-page milestones. A thousand visitors bouncing in three seconds have zero quality; 100 visitors spending five minutes exploring your site have high quality. Prioritize your SEO efforts on keywords that generate engaged visitors, not raw volume.
What organic traffic metrics matter most for business growth?
Organic conversion rate, revenue per session, and cost per acquisition are the metrics that directly connect to business growth. Organic conversion rates range from 2-5% for B2B SaaS and 1-3% for e-commerce, though high-intent commercial keywords often exceed 8% conversion. Track these metrics in Google Analytics 4 by filtering organic search traffic and segmenting by landing page and campaign. Compare conversion rates across keywords and content types to identify which segments drive revenue. A page generating 500 monthly organic visitors with a 5% conversion rate (25 conversions) outperforms a page with 5,000 visitors and 0.5% conversion rate (25 conversions) because both deliver identical business value with a 90% smaller ranking requirement.
How should I respond to Google AI Overviews affecting my organic traffic?
AI Overviews reduce organic CTR by 65% on affected queries, but the traffic that remains is often higher-intent. Identify which keywords trigger AI Overviews using tools like DataSlayer or manual SERP inspection, then segment their performance separately. For keywords with AI Overviews, optimize for featured snippets (which appear above AI Overviews), target long-tail keyword variations, and focus on long-form content designed for users seeking detailed information beyond the summary. For keywords without AI Overviews, maintain traditional CTR optimization. Additionally, track zero-click search visibility—if your content appears in Knowledge Panels or featured snippets, you're building brand authority even without clicks. Shift your mindset from maximizing clicks to maximizing qualified conversions from the traffic that does click through.